29
/
en
AIzaSyAYiBZKx7MnpbEhh9jyipgxe19OcubqV5w
April 1, 2024
275803
United Kingdom
GBR
true
2
1
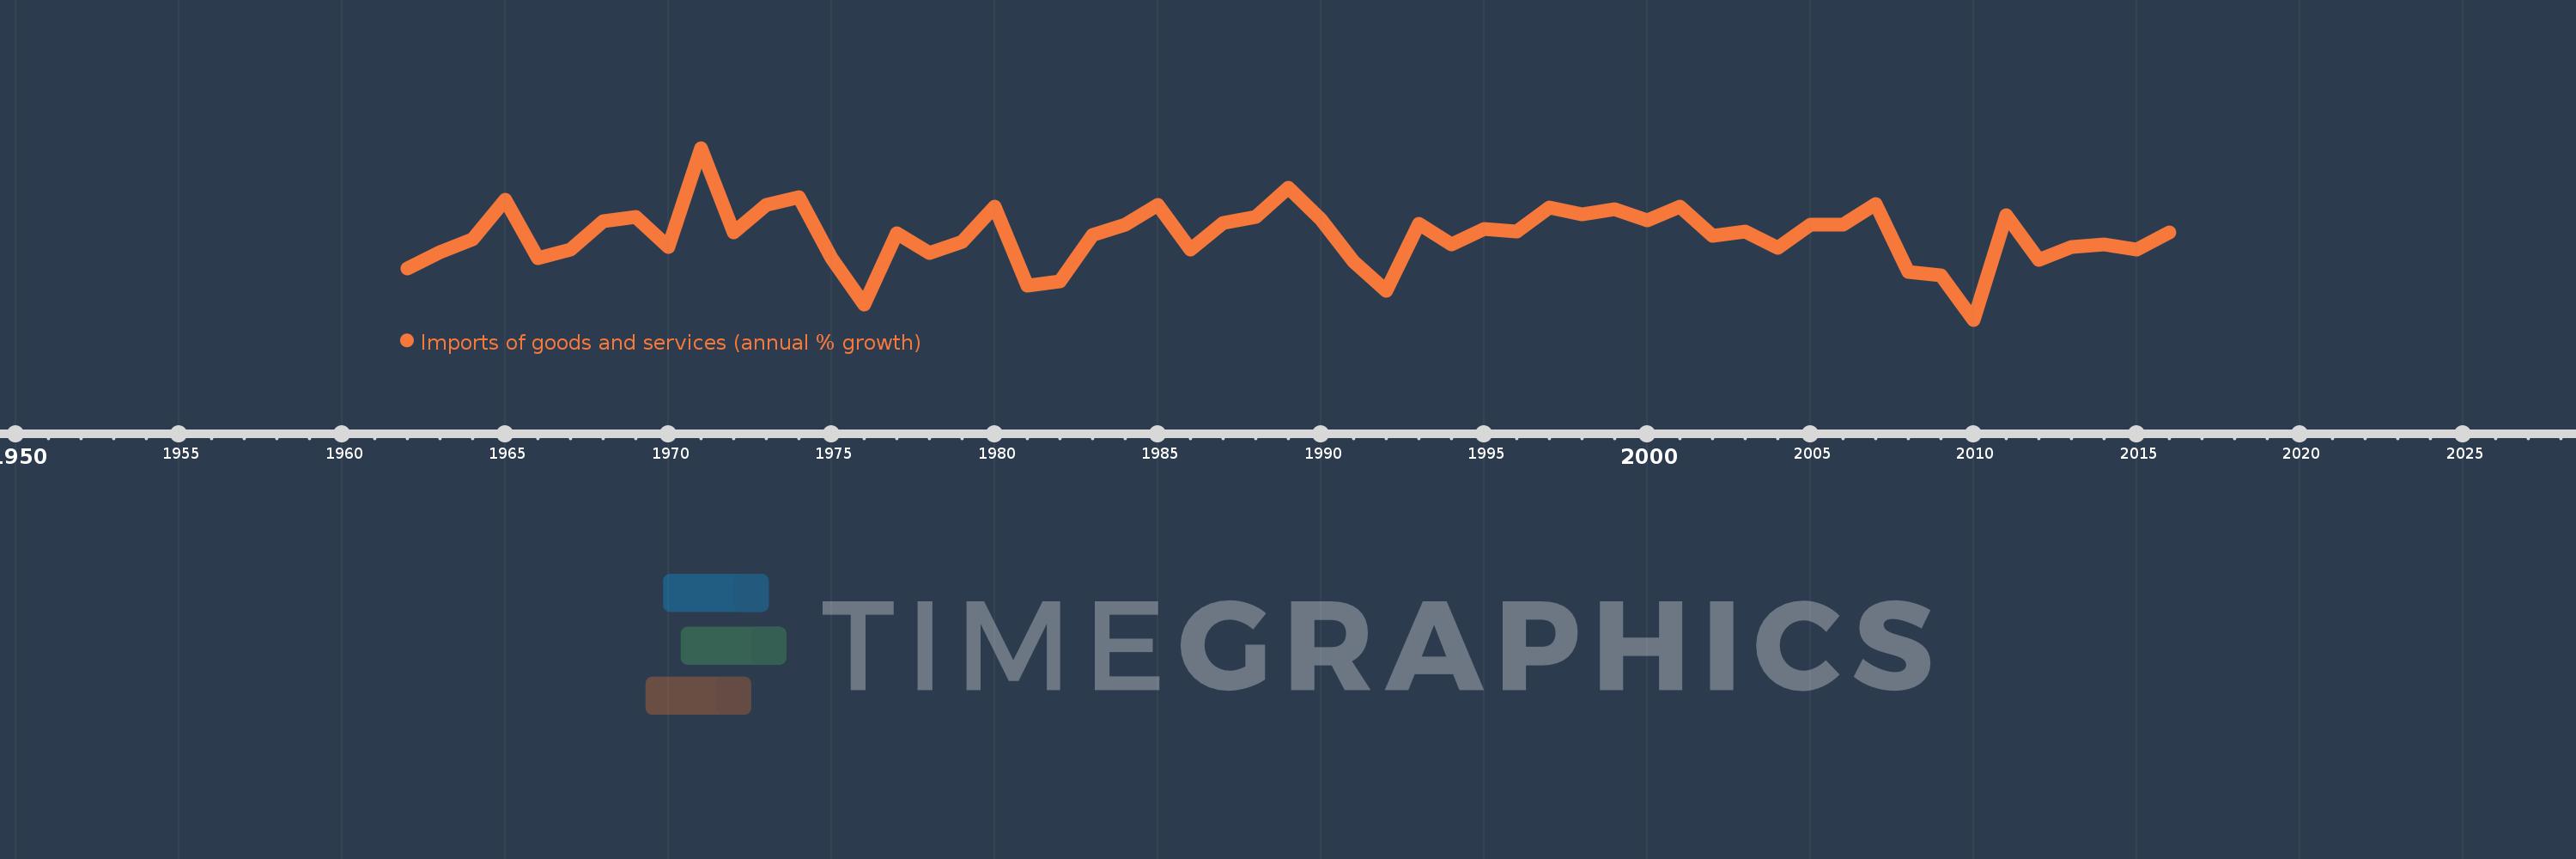
Imports of goods and services (annual % growth)
2016,2015,2014,2013,2012,2011,2010,2009,2008,2007,2006,2005,2004,2003,2002,2001,2000,1999,1998,1997,1996,1995,1994,1993,1992,1991,1990,1989,1988,1987,1986,1985,1984,1983,1982,1981,1980,1979,1978,1977,1976,1975,1974,1973,1972,1971,1970,1969,1968,1967,1966,1965,1964,1963,1962
This statistics in other country:
AlbaniaAlgeriaAngolaAntigua and BarbudaArab WorldArgentinaArmeniaAustraliaAustriaAzerbaijanBahamas, TheBahrainBangladeshBarbadosBelarusBelgiumBelizeBeninBhutanBoliviaBosnia and HerzegovinaBotswanaBrazilBrunei DarussalamBulgariaBurkina FasoBurundiCabo VerdeCambodiaCameroonCanadaCaribbean small statesCentral Europe and the BalticsChadChileColombiaComorosCongo, Dem. Rep.Congo, Rep.Costa RicaCote d'IvoireCroatiaCubaCyprusCzech RepublicDenmarkDjiboutiDominican RepublicEarly-demographic dividendEast Asia & PacificEcuadorEgypt, Arab Rep.El SalvadorEquatorial GuineaEritreaEstoniaEthiopiaEuro areaEurope & Central AsiaEurope & Central Asia (excluding high income)Europe & Central Asia (IDA & IBRD countries)European UnionFijiFinlandFranceGabonGambia, TheGeorgiaGermanyGhanaGreeceGuatemalaGuineaGuinea-BissauHaitiHeavily indebted poor countries (HIPC)High incomeHondurasHong Kong SAR, ChinaHungaryIBRD onlyIcelandIDA & IBRD totalIDA blendIDA onlyIDA totalIndiaIndonesiaIran, Islamic Rep.IrelandIsraelItalyJamaicaJapanJordanKazakhstanKenyaKorea, Rep.KosovoKuwaitKyrgyz RepublicLao PDRLatin America & Caribbean Latin America & Caribbean (excluding high income)Latin America & the Caribbean (IDA & IBRD countries)LatviaLeast developed countries: UN classificationLebanonLiberiaLibyaLithuaniaLow & middle incomeLow incomeLower middle incomeLuxembourgMacao SAR, ChinaMacedonia, FYRMadagascarMalawiMalaysiaMaliMaltaMauritaniaMauritiusMexicoMiddle East & North AfricaMiddle East & North Africa (excluding high income)Middle East & North Africa (IDA & IBRD countries)Middle incomeMoldovaMongoliaMontenegroMoroccoMozambiqueMyanmarNamibiaNepalNetherlandsNew ZealandNicaraguaNigerNigeriaNorth AmericaNorwayOECD membersOmanOther small statesPakistanPanamaPapua New GuineaParaguayPeruPhilippinesPolandPortugalPost-demographic dividendPre-demographic dividendPuerto RicoQatarRomaniaRussian FederationRwandaSamoaSaudi ArabiaSenegalSerbiaSeychellesSierra LeoneSingaporeSlovak RepublicSloveniaSmall statesSomaliaSouth AfricaSouth AsiaSouth Asia (IDA & IBRD)South SudanSpainSri LankaSub-Saharan Africa Sub-Saharan Africa (excluding high income)Sub-Saharan Africa (IDA & IBRD countries)SudanSurinameSwazilandSwedenSwitzerlandSyrian Arab RepublicTajikistanTanzaniaThailandTimor-LesteTogoTrinidad and TobagoTunisiaTurkeyTurkmenistanUgandaUkraineUnited Arab EmiratesUnited KingdomUnited StatesUruguayUzbekistanVanuatuVenezuela, RBVietnamWest Bank and GazaWorldZambiaZimbabwe Timeline:
This timeline shows a graph from 1962 to 2016 of United Kingdom. No data until 1961. Number of actual observations by date: 55.
Source name:
World Development Indicators
Source organization:
World Bank national accounts data, and OECD National Accounts data files.
Categories, topics:
Economy & Growth, Trade
Last updated:
apr 23, 2017
Indicators value changes by year
Minimum:
-9.176
jan 1, 2010
Maximum:
19.386
jan 1, 1971
At the date of observation
Value
Absolute change
Change from previous value
jan 1, 1962
-0.703
-0.703
0.0%
jan 1, 1963
2.095
+2.798
-397.9%
jan 1, 1964
4.176
+2.082
99.37%
jan 1, 1965
10.837
+6.661
159.49%
jan 1, 1966
1.124
-9.713
-89.63%
jan 1, 1967
2.463
+1.34
119.21%
jan 1, 1968
7.235
+4.772
193.71%
jan 1, 1969
7.941
+0.706
9.76%
jan 1, 1970
2.921
-5.02
-63.22%
jan 1, 1971
19.386
+16.465
563.65%
jan 1, 1972
5.379
-14.007
-72.25%
jan 1, 1973
9.918
+4.539
84.38%
jan 1, 1974
11.184
+1.266
12.77%
jan 1, 1975
1.005
-10.18
-91.01%
jan 1, 1976
-6.593
-7.598
-756.05%
jan 1, 1977
5.159
+11.752
-178.24%
jan 1, 1978
1.922
-3.236
-62.74%
jan 1, 1979
3.731
+1.809
94.11%
jan 1, 1980
9.645
+5.913
158.47%
jan 1, 1981
-3.525
-13.17
-136.55%
jan 1, 1982
-2.737
+0.789
-22.37%
jan 1, 1983
4.931
+7.667
-280.17%
jan 1, 1984
6.565
+1.634
33.15%
jan 1, 1985
9.876
+3.311
50.43%
jan 1, 1986
2.518
-7.358
-74.5%
jan 1, 1987
6.873
+4.355
172.94%
jan 1, 1988
7.886
+1.013
14.73%
jan 1, 1989
12.782
+4.896
62.09%
jan 1, 1990
7.421
-5.361
-41.94%
jan 1, 1991
0.562
-6.859
-92.42%
jan 1, 1992
-4.376
-4.938
-878.16%
jan 1, 1993
6.781
+11.157
-254.98%
jan 1, 1994
3.321
-3.461
-51.03%
jan 1, 1995
5.935
+2.614
78.71%
jan 1, 1996
5.543
-0.391
-6.59%
jan 1, 1997
9.522
+3.979
71.78%
jan 1, 1998
8.283
-1.239
-13.01%
jan 1, 1999
9.154
+0.871
10.52%
jan 1, 2000
7.354
-1.8
-19.67%
jan 1, 2001
9.573
+2.219
30.18%
jan 1, 2002
4.735
-4.838
-50.54%
jan 1, 2003
5.515
+0.78
16.48%
jan 1, 2004
2.73
-2.785
-50.49%
jan 1, 2005
6.629
+3.898
142.78%
jan 1, 2006
6.575
-0.054
-0.81%
jan 1, 2007
10.066
+3.492
53.11%
jan 1, 2008
-1.195
-11.261
-111.87%
jan 1, 2009
-1.855
-0.66
55.28%
jan 1, 2010
-9.176
-7.321
394.68%
jan 1, 2011
8.155
+17.331
-188.87%
jan 1, 2012
0.825
-7.33
-89.88%
jan 1, 2013
2.855
+2.03
245.94%
jan 1, 2014
3.417
+0.562
19.68%
jan 1, 2015
2.534
-0.883
-25.85%
jan 1, 2016
5.386
+2.852
112.57%
Ranking of countries by current statistics by years


Comments: