29
/
en
AIzaSyAYiBZKx7MnpbEhh9jyipgxe19OcubqV5w
April 1, 2024
209432
New Zealand
NZL
true
2
1
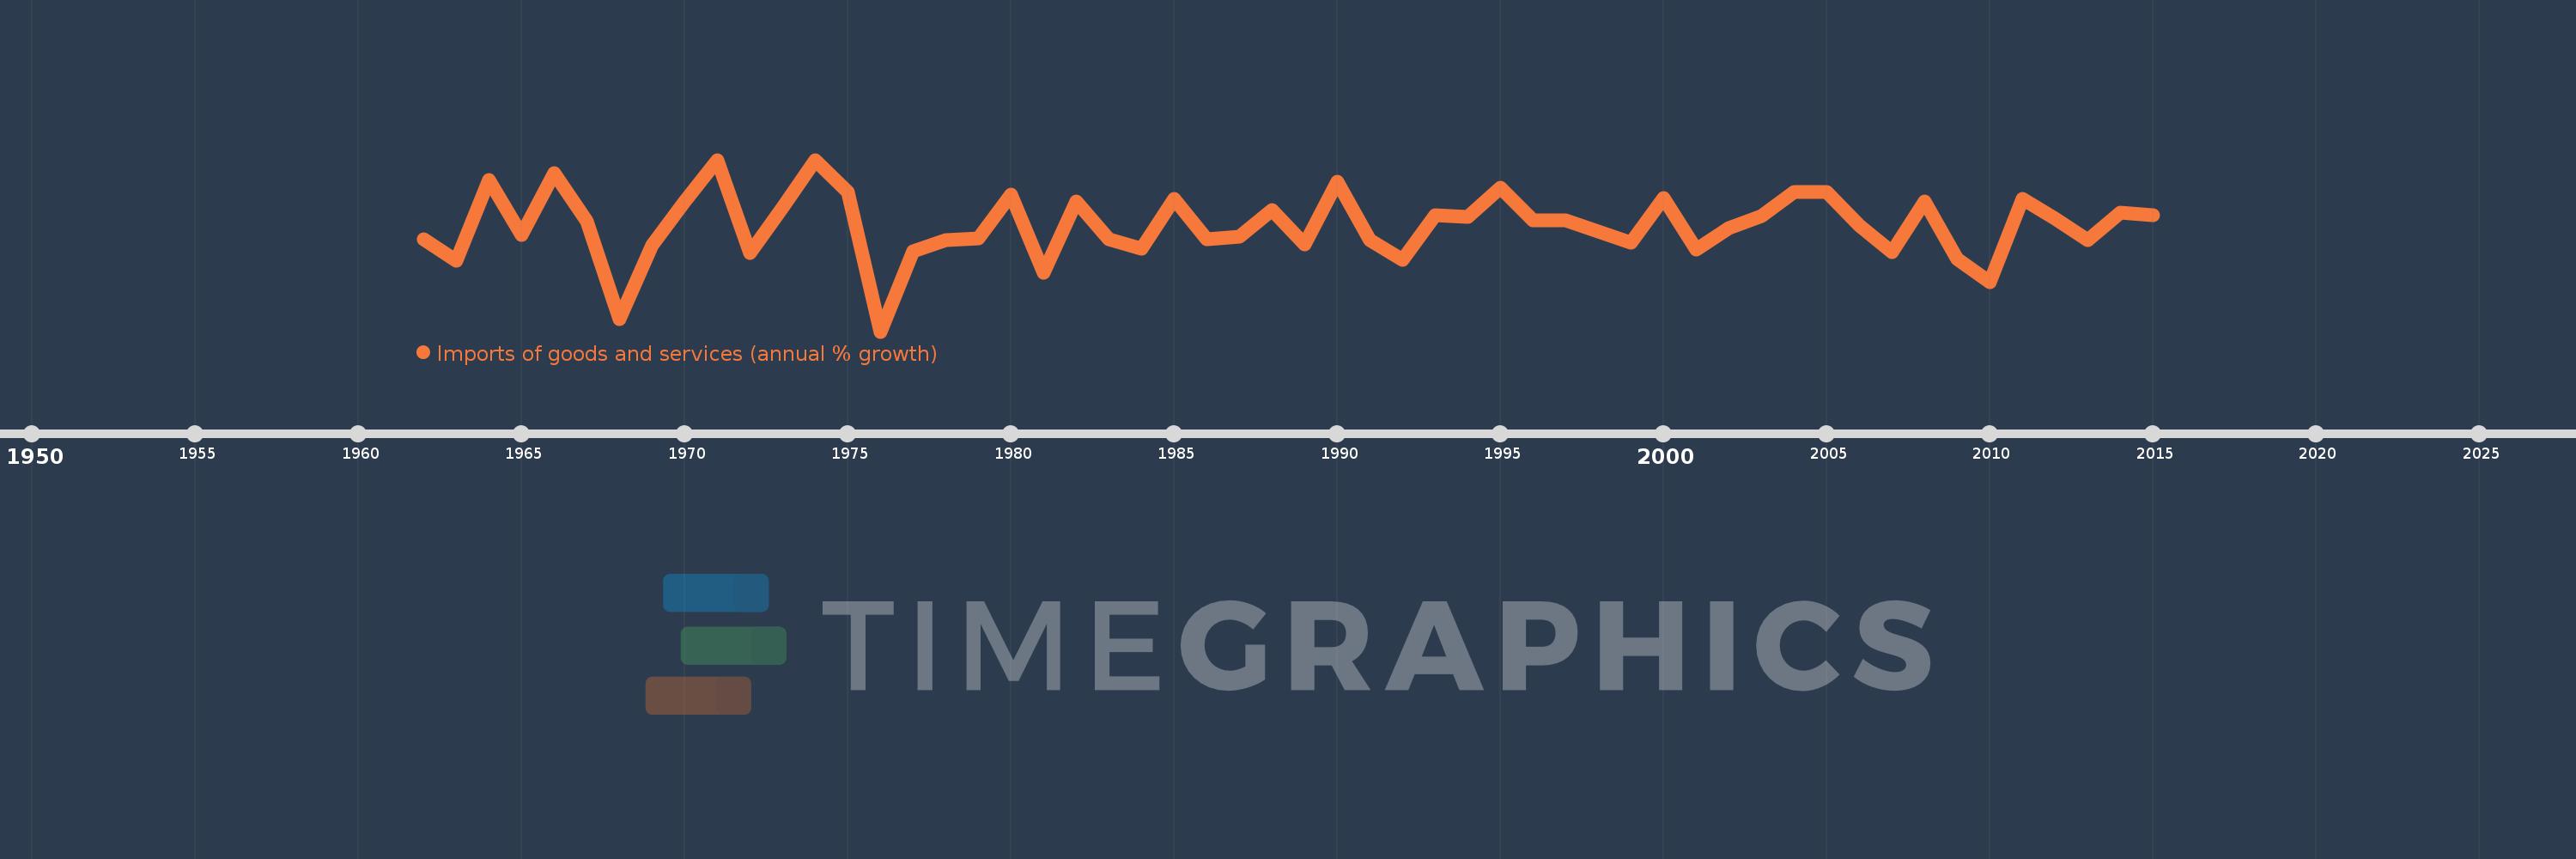
Imports of goods and services (annual % growth)
2015,2014,2013,2012,2011,2010,2009,2008,2007,2006,2005,2004,2003,2002,2001,2000,1999,1998,1997,1996,1995,1994,1993,1992,1991,1990,1989,1988,1987,1986,1985,1984,1983,1982,1981,1980,1979,1978,1977,1976,1975,1974,1973,1972,1971,1970,1969,1968,1967,1966,1965,1964,1963,1962
This statistics in other country:
AlbaniaAlgeriaAngolaAntigua and BarbudaArab WorldArgentinaArmeniaAustraliaAustriaAzerbaijanBahamas, TheBahrainBangladeshBarbadosBelarusBelgiumBelizeBeninBhutanBoliviaBosnia and HerzegovinaBotswanaBrazilBrunei DarussalamBulgariaBurkina FasoBurundiCabo VerdeCambodiaCameroonCanadaCaribbean small statesCentral Europe and the BalticsChadChileColombiaComorosCongo, Dem. Rep.Congo, Rep.Costa RicaCote d'IvoireCroatiaCubaCyprusCzech RepublicDenmarkDjiboutiDominican RepublicEarly-demographic dividendEast Asia & PacificEcuadorEgypt, Arab Rep.El SalvadorEquatorial GuineaEritreaEstoniaEthiopiaEuro areaEurope & Central AsiaEurope & Central Asia (excluding high income)Europe & Central Asia (IDA & IBRD countries)European UnionFijiFinlandFranceGabonGambia, TheGeorgiaGermanyGhanaGreeceGuatemalaGuineaGuinea-BissauHaitiHeavily indebted poor countries (HIPC)High incomeHondurasHong Kong SAR, ChinaHungaryIBRD onlyIcelandIDA & IBRD totalIDA blendIDA onlyIDA totalIndiaIndonesiaIran, Islamic Rep.IrelandIsraelItalyJamaicaJapanJordanKazakhstanKenyaKorea, Rep.KosovoKuwaitKyrgyz RepublicLao PDRLatin America & Caribbean Latin America & Caribbean (excluding high income)Latin America & the Caribbean (IDA & IBRD countries)LatviaLeast developed countries: UN classificationLebanonLiberiaLibyaLithuaniaLow & middle incomeLow incomeLower middle incomeLuxembourgMacao SAR, ChinaMacedonia, FYRMadagascarMalawiMalaysiaMaliMaltaMauritaniaMauritiusMexicoMiddle East & North AfricaMiddle East & North Africa (excluding high income)Middle East & North Africa (IDA & IBRD countries)Middle incomeMoldovaMongoliaMontenegroMoroccoMozambiqueMyanmarNamibiaNepalNetherlandsNew ZealandNicaraguaNigerNigeriaNorth AmericaNorwayOECD membersOmanOther small statesPakistanPanamaPapua New GuineaParaguayPeruPhilippinesPolandPortugalPost-demographic dividendPre-demographic dividendPuerto RicoQatarRomaniaRussian FederationRwandaSamoaSaudi ArabiaSenegalSerbiaSeychellesSierra LeoneSingaporeSlovak RepublicSloveniaSmall statesSomaliaSouth AfricaSouth AsiaSouth Asia (IDA & IBRD)South SudanSpainSri LankaSub-Saharan Africa Sub-Saharan Africa (excluding high income)Sub-Saharan Africa (IDA & IBRD countries)SudanSurinameSwazilandSwedenSwitzerlandSyrian Arab RepublicTajikistanTanzaniaThailandTimor-LesteTogoTrinidad and TobagoTunisiaTurkeyTurkmenistanUgandaUkraineUnited Arab EmiratesUnited KingdomUnited StatesUruguayUzbekistanVanuatuVenezuela, RBVietnamWest Bank and GazaWorldZambiaZimbabwe Timeline:
This timeline shows a graph from 1962 to 2015 of New Zealand. No data until 1961. Number of actual observations by date: 54.
Source name:
World Development Indicators
Source organization:
World Bank national accounts data, and OECD National Accounts data files.
Categories, topics:
Economy & Growth, Trade
Last updated:
apr 23, 2017
Indicators value changes by year
Minimum:
-21.596
jan 1, 1976
Maximum:
21.321
jan 1, 1974
At the date of observation
Value
Absolute change
Change from previous value
jan 1, 1962
1.472
+1.472
0.0%
jan 1, 1963
-3.814
-5.286
-359.18%
jan 1, 1964
16.345
+20.159
-528.51%
jan 1, 1965
2.527
-13.818
-84.54%
jan 1, 1966
17.937
+15.41
609.76%
jan 1, 1967
5.987
-11.95
-66.62%
jan 1, 1968
-18.528
-24.515
-409.47%
jan 1, 1969
-0.119
+18.409
-99.36%
jan 1, 1970
10.882
+11.001
-9.26K%
jan 1, 1971
21.264
+10.382
95.41%
jan 1, 1972
-1.931
-23.195
-109.08%
jan 1, 1973
9.339
+11.27
-583.58%
jan 1, 1974
21.321
+11.982
128.31%
jan 1, 1975
13.278
-8.043
-37.72%
jan 1, 1976
-21.596
-34.874
-262.65%
jan 1, 1977
-1.503
+20.094
-93.04%
jan 1, 1978
1.2
+2.702
-179.85%
jan 1, 1979
1.634
+0.435
36.22%
jan 1, 1980
12.532
+10.898
666.74%
jan 1, 1981
-6.894
-19.426
-155.01%
jan 1, 1982
10.975
+17.869
-259.2%
jan 1, 1983
1.455
-9.52
-86.74%
jan 1, 1984
-0.791
-2.246
-154.38%
jan 1, 1985
11.534
+12.325
-1.56K%
jan 1, 1986
1.526
-10.009
-86.77%
jan 1, 1987
2.031
+0.505
33.12%
jan 1, 1988
8.665
+6.634
326.63%
jan 1, 1989
0.189
-8.475
-97.81%
jan 1, 1990
15.8
+15.611
8.24K%
jan 1, 1991
1.283
-14.517
-91.88%
jan 1, 1992
-3.7
-4.983
-388.3%
jan 1, 1993
7.435
+11.134
-300.96%
jan 1, 1994
7.121
-0.314
-4.22%
jan 1, 1995
14.296
+7.176
100.78%
jan 1, 1996
6.296
-8.0
-55.96%
jan 1, 1997
6.282
-0.014
-0.22%
jan 1, 1998
3.496
-2.786
-44.35%
jan 1, 1999
0.575
-2.921
-83.54%
jan 1, 2000
11.716
+11.14
1.94K%
jan 1, 2001
-1.132
-12.848
-109.66%
jan 1, 2002
4.279
+5.411
-477.87%
jan 1, 2003
7.35
+3.071
71.77%
jan 1, 2004
13.17
+5.821
79.19%
jan 1, 2005
13.364
+0.194
1.47%
jan 1, 2006
4.875
-8.489
-63.52%
jan 1, 2007
-1.679
-6.553
-134.44%
jan 1, 2008
10.913
+12.591
-750.0%
jan 1, 2009
-3.483
-14.396
-131.92%
jan 1, 2010
-9.348
-5.865
168.38%
jan 1, 2011
11.495
+20.842
-222.96%
jan 1, 2012
6.575
-4.92
-42.8%
jan 1, 2013
1.33
-5.245
-79.77%
jan 1, 2014
8.119
+6.789
510.5%
jan 1, 2015
7.429
-0.691
-8.5%
Ranking of countries by current statistics by years


Comments: