29
/
en
AIzaSyAYiBZKx7MnpbEhh9jyipgxe19OcubqV5w
April 1, 2024
163875
Japan
JPN
true
2
1
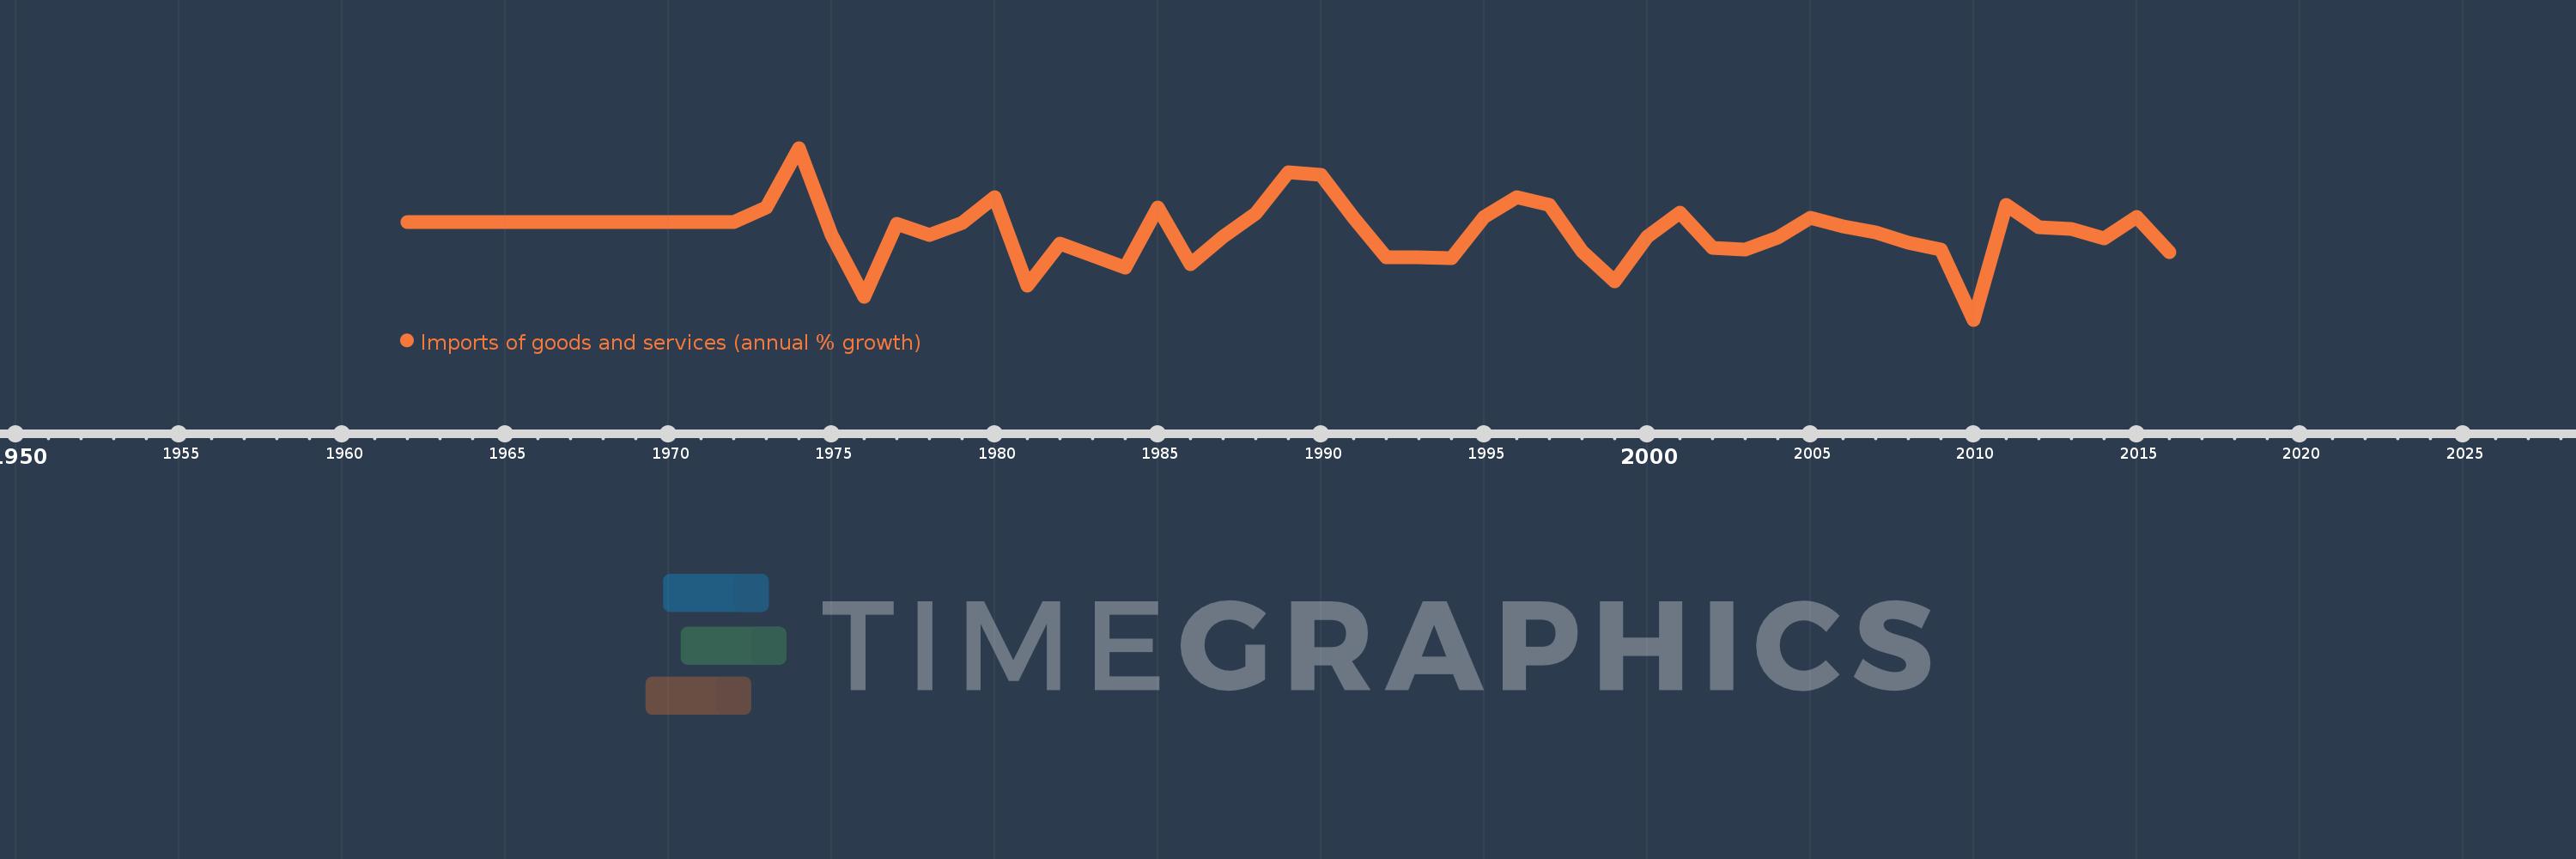
Imports of goods and services (annual % growth)
2016,2015,2014,2013,2012,2011,2010,2009,2008,2007,2006,2005,2004,2003,2002,2001,2000,1999,1998,1997,1996,1995,1994,1993,1992,1991,1990,1989,1988,1987,1986,1985,1984,1983,1982,1981,1980,1979,1978,1977,1976,1975,1974,1973,1972,1971,1970,1969,1968,1967,1966,1965,1964,1963,1962
This statistics in other country:
AlbaniaAlgeriaAngolaAntigua and BarbudaArab WorldArgentinaArmeniaAustraliaAustriaAzerbaijanBahamas, TheBahrainBangladeshBarbadosBelarusBelgiumBelizeBeninBhutanBoliviaBosnia and HerzegovinaBotswanaBrazilBrunei DarussalamBulgariaBurkina FasoBurundiCabo VerdeCambodiaCameroonCanadaCaribbean small statesCentral Europe and the BalticsChadChileColombiaComorosCongo, Dem. Rep.Congo, Rep.Costa RicaCote d'IvoireCroatiaCubaCyprusCzech RepublicDenmarkDjiboutiDominican RepublicEarly-demographic dividendEast Asia & PacificEcuadorEgypt, Arab Rep.El SalvadorEquatorial GuineaEritreaEstoniaEthiopiaEuro areaEurope & Central AsiaEurope & Central Asia (excluding high income)Europe & Central Asia (IDA & IBRD countries)European UnionFijiFinlandFranceGabonGambia, TheGeorgiaGermanyGhanaGreeceGuatemalaGuineaGuinea-BissauHaitiHeavily indebted poor countries (HIPC)High incomeHondurasHong Kong SAR, ChinaHungaryIBRD onlyIcelandIDA & IBRD totalIDA blendIDA onlyIDA totalIndiaIndonesiaIran, Islamic Rep.IrelandIsraelItalyJamaicaJapanJordanKazakhstanKenyaKorea, Rep.KosovoKuwaitKyrgyz RepublicLao PDRLatin America & Caribbean Latin America & Caribbean (excluding high income)Latin America & the Caribbean (IDA & IBRD countries)LatviaLeast developed countries: UN classificationLebanonLiberiaLibyaLithuaniaLow & middle incomeLow incomeLower middle incomeLuxembourgMacao SAR, ChinaMacedonia, FYRMadagascarMalawiMalaysiaMaliMaltaMauritaniaMauritiusMexicoMiddle East & North AfricaMiddle East & North Africa (excluding high income)Middle East & North Africa (IDA & IBRD countries)Middle incomeMoldovaMongoliaMontenegroMoroccoMozambiqueMyanmarNamibiaNepalNetherlandsNew ZealandNicaraguaNigerNigeriaNorth AmericaNorwayOECD membersOmanOther small statesPakistanPanamaPapua New GuineaParaguayPeruPhilippinesPolandPortugalPost-demographic dividendPre-demographic dividendPuerto RicoQatarRomaniaRussian FederationRwandaSamoaSaudi ArabiaSenegalSerbiaSeychellesSierra LeoneSingaporeSlovak RepublicSloveniaSmall statesSomaliaSouth AfricaSouth AsiaSouth Asia (IDA & IBRD)South SudanSpainSri LankaSub-Saharan Africa Sub-Saharan Africa (excluding high income)Sub-Saharan Africa (IDA & IBRD countries)SudanSurinameSwazilandSwedenSwitzerlandSyrian Arab RepublicTajikistanTanzaniaThailandTimor-LesteTogoTrinidad and TobagoTunisiaTurkeyTurkmenistanUgandaUkraineUnited Arab EmiratesUnited KingdomUnited StatesUruguayUzbekistanVanuatuVenezuela, RBVietnamWest Bank and GazaWorldZambiaZimbabwe Timeline:
This timeline shows a graph from 1962 to 2016 of Japan. No data until 1961. Number of actual observations by date: 55.
Source name:
World Development Indicators
Source organization:
World Bank national accounts data, and OECD National Accounts data files.
Categories, topics:
Economy & Growth, Trade
Last updated:
apr 23, 2017
Indicators value changes by year
Minimum:
-15.65
jan 1, 2010
Maximum:
24.333
jan 1, 1974
At the date of observation
Value
Absolute change
Change from previous value
jan 1, 1962
7.045
+7.045
0.0%
jan 1, 1963
7.045
0.0
0.0%
jan 1, 1964
7.045
+0.0
0.0%
jan 1, 1965
7.045
0.0
0.0%
jan 1, 1966
7.045
+0.0
0.0%
jan 1, 1967
7.045
0.0
0.0%
jan 1, 1968
7.045
+0.0
0.0%
jan 1, 1969
7.045
0.0
0.0%
jan 1, 1970
7.045
+0.0
0.0%
jan 1, 1971
7.045
0.0
0.0%
jan 1, 1972
7.045
+0.0
0.0%
jan 1, 1973
10.501
+3.456
49.05%
jan 1, 1974
24.333
+13.832
131.72%
jan 1, 1975
4.181
-20.152
-82.82%
jan 1, 1976
-10.29
-14.472
-346.12%
jan 1, 1977
6.675
+16.966
-164.87%
jan 1, 1978
4.09
-2.586
-38.73%
jan 1, 1979
6.911
+2.822
69.0%
jan 1, 1980
12.912
+6.001
86.83%
jan 1, 1981
-7.761
-20.673
-160.11%
jan 1, 1982
2.136
+9.897
-127.53%
jan 1, 1983
-0.674
-2.81
-131.53%
jan 1, 1984
-3.443
-2.77
411.2%
jan 1, 1985
10.537
+13.98
-406.0%
jan 1, 1986
-2.691
-13.228
-125.53%
jan 1, 1987
3.756
+6.447
-239.61%
jan 1, 1988
9.018
+5.262
140.08%
jan 1, 1989
18.661
+9.644
106.94%
jan 1, 1990
17.994
-0.667
-3.58%
jan 1, 1991
8.106
-9.888
-54.95%
jan 1, 1992
-1.112
-9.218
-113.72%
jan 1, 1993
-1.087
+0.025
-2.27%
jan 1, 1994
-1.285
-0.197
18.16%
jan 1, 1995
8.194
+9.479
-737.88%
jan 1, 1996
12.921
+4.726
57.68%
jan 1, 1997
11.029
-1.892
-14.65%
jan 1, 1998
0.348
-10.681
-96.84%
jan 1, 1999
-6.708
-7.056
-2.03K%
jan 1, 2000
3.606
+10.314
-153.75%
jan 1, 2001
9.267
+5.661
157.01%
jan 1, 2002
1.029
-8.238
-88.89%
jan 1, 2003
0.687
-0.342
-33.23%
jan 1, 2004
3.397
+2.709
394.33%
jan 1, 2005
8.121
+4.724
139.09%
jan 1, 2006
6.1
-2.021
-24.88%
jan 1, 2007
4.707
-1.393
-22.83%
jan 1, 2008
2.185
-2.523
-53.59%
jan 1, 2009
0.697
-1.488
-68.11%
jan 1, 2010
-15.65
-16.347
-2.35K%
jan 1, 2011
11.173
+26.823
-171.39%
jan 1, 2012
5.804
-5.369
-48.05%
jan 1, 2013
5.41
-0.394
-6.79%
jan 1, 2014
3.274
-2.136
-39.49%
jan 1, 2015
8.268
+4.994
152.57%
jan 1, 2016
0.127
-8.14
-98.46%
Ranking of countries by current statistics by years


Comments: