29
/
en
AIzaSyAYiBZKx7MnpbEhh9jyipgxe19OcubqV5w
April 1, 2024
144498
Guatemala
GTM
true
2
1
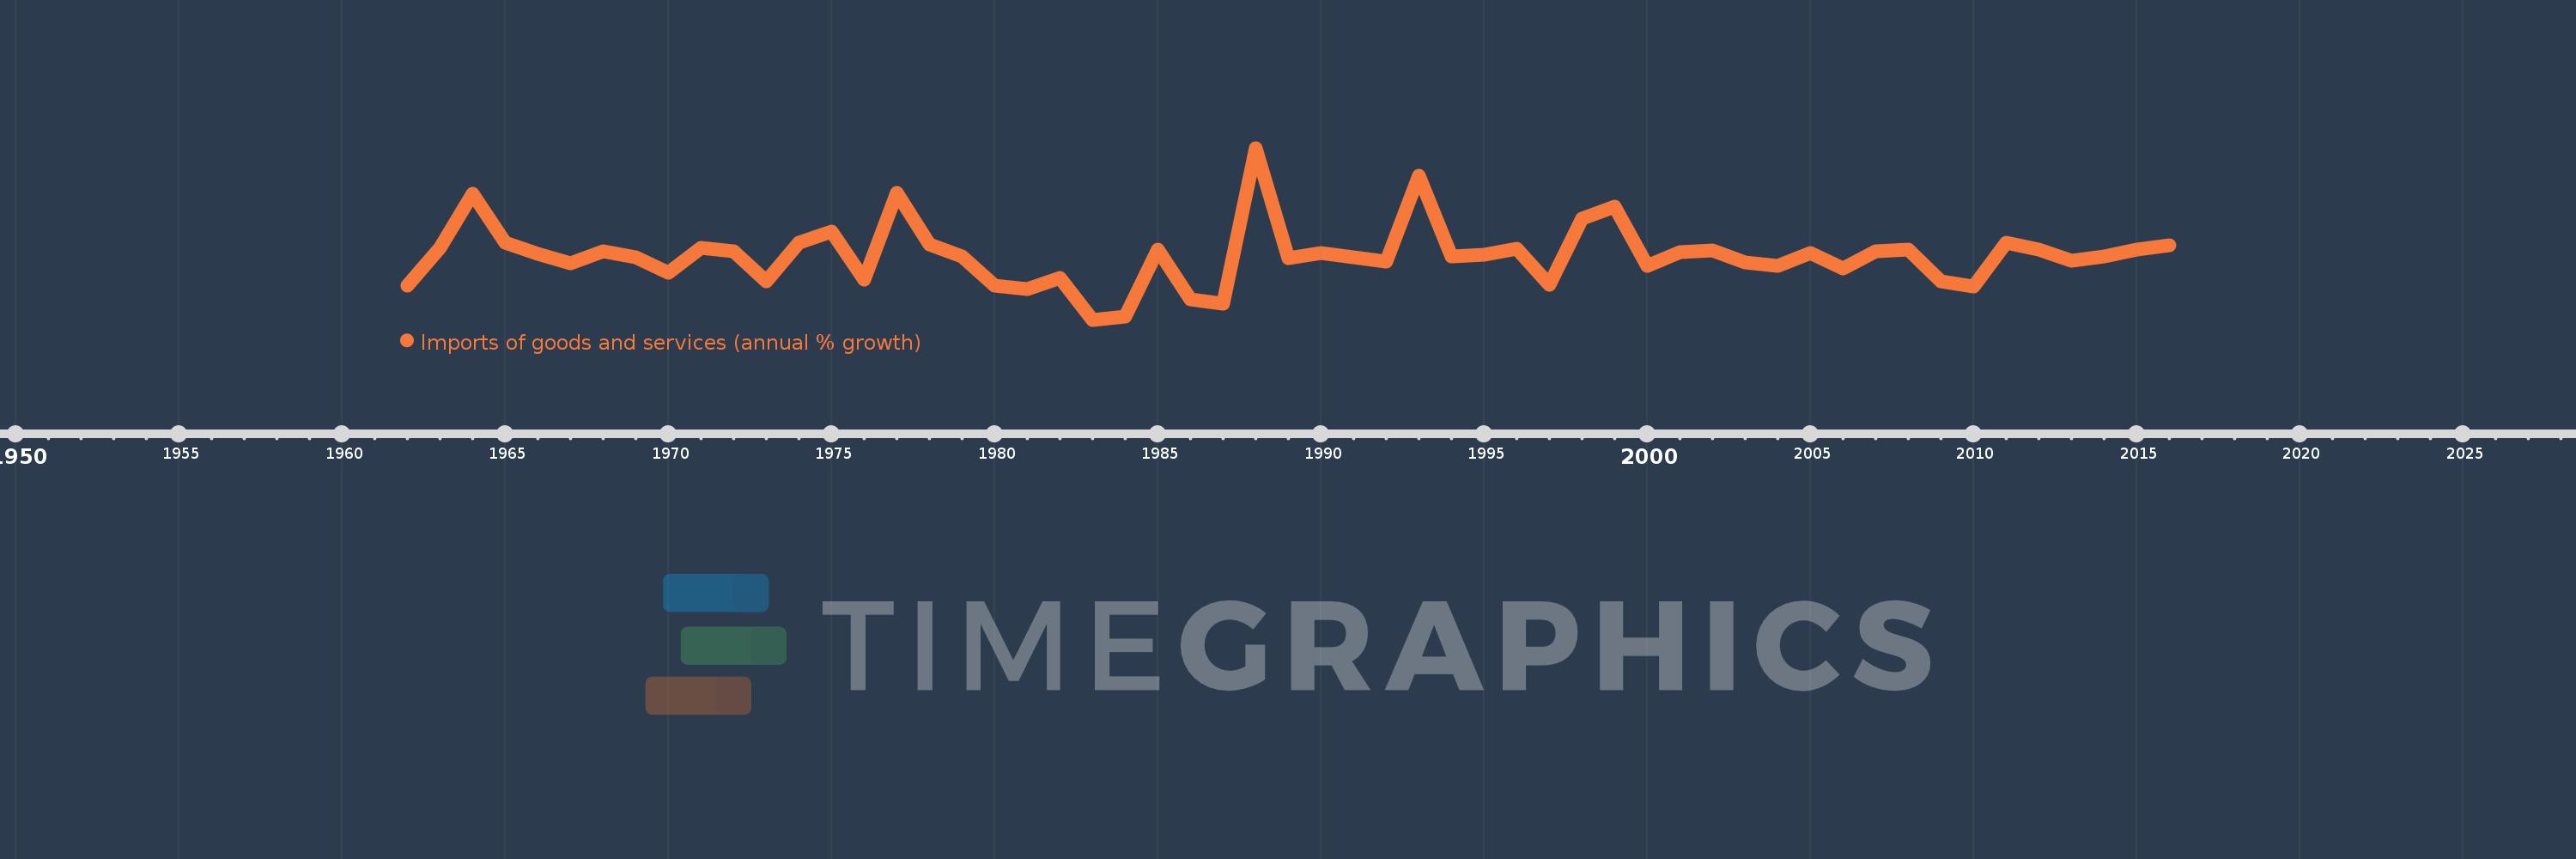
Imports of goods and services (annual % growth)
2016,2015,2014,2013,2012,2011,2010,2009,2008,2007,2006,2005,2004,2003,2002,2001,2000,1999,1998,1997,1996,1995,1994,1993,1992,1991,1990,1989,1988,1987,1986,1985,1984,1983,1982,1981,1980,1979,1978,1977,1976,1975,1974,1973,1972,1971,1970,1969,1968,1967,1966,1965,1964,1963,1962
This statistics in other country:
AlbaniaAlgeriaAngolaAntigua and BarbudaArab WorldArgentinaArmeniaAustraliaAustriaAzerbaijanBahamas, TheBahrainBangladeshBarbadosBelarusBelgiumBelizeBeninBhutanBoliviaBosnia and HerzegovinaBotswanaBrazilBrunei DarussalamBulgariaBurkina FasoBurundiCabo VerdeCambodiaCameroonCanadaCaribbean small statesCentral Europe and the BalticsChadChileColombiaComorosCongo, Dem. Rep.Congo, Rep.Costa RicaCote d'IvoireCroatiaCubaCyprusCzech RepublicDenmarkDjiboutiDominican RepublicEarly-demographic dividendEast Asia & PacificEcuadorEgypt, Arab Rep.El SalvadorEquatorial GuineaEritreaEstoniaEthiopiaEuro areaEurope & Central AsiaEurope & Central Asia (excluding high income)Europe & Central Asia (IDA & IBRD countries)European UnionFijiFinlandFranceGabonGambia, TheGeorgiaGermanyGhanaGreeceGuatemalaGuineaGuinea-BissauHaitiHeavily indebted poor countries (HIPC)High incomeHondurasHong Kong SAR, ChinaHungaryIBRD onlyIcelandIDA & IBRD totalIDA blendIDA onlyIDA totalIndiaIndonesiaIran, Islamic Rep.IrelandIsraelItalyJamaicaJapanJordanKazakhstanKenyaKorea, Rep.KosovoKuwaitKyrgyz RepublicLao PDRLatin America & Caribbean Latin America & Caribbean (excluding high income)Latin America & the Caribbean (IDA & IBRD countries)LatviaLeast developed countries: UN classificationLebanonLiberiaLibyaLithuaniaLow & middle incomeLow incomeLower middle incomeLuxembourgMacao SAR, ChinaMacedonia, FYRMadagascarMalawiMalaysiaMaliMaltaMauritaniaMauritiusMexicoMiddle East & North AfricaMiddle East & North Africa (excluding high income)Middle East & North Africa (IDA & IBRD countries)Middle incomeMoldovaMongoliaMontenegroMoroccoMozambiqueMyanmarNamibiaNepalNetherlandsNew ZealandNicaraguaNigerNigeriaNorth AmericaNorwayOECD membersOmanOther small statesPakistanPanamaPapua New GuineaParaguayPeruPhilippinesPolandPortugalPost-demographic dividendPre-demographic dividendPuerto RicoQatarRomaniaRussian FederationRwandaSamoaSaudi ArabiaSenegalSerbiaSeychellesSierra LeoneSingaporeSlovak RepublicSloveniaSmall statesSomaliaSouth AfricaSouth AsiaSouth Asia (IDA & IBRD)South SudanSpainSri LankaSub-Saharan Africa Sub-Saharan Africa (excluding high income)Sub-Saharan Africa (IDA & IBRD countries)SudanSurinameSwazilandSwedenSwitzerlandSyrian Arab RepublicTajikistanTanzaniaThailandTimor-LesteTogoTrinidad and TobagoTunisiaTurkeyTurkmenistanUgandaUkraineUnited Arab EmiratesUnited KingdomUnited StatesUruguayUzbekistanVanuatuVenezuela, RBVietnamWest Bank and GazaWorldZambiaZimbabwe Timeline:
This timeline shows a graph from 1962 to 2016 of Guatemala. No data until 1961. Number of actual observations by date: 55.
Source name:
World Development Indicators
Source organization:
World Bank national accounts data, and OECD National Accounts data files.
Categories, topics:
Economy & Growth, Trade
Last updated:
apr 23, 2017
Indicators value changes by year
Minimum:
-20.988
jan 1, 1983
Maximum:
47.846
jan 1, 1988
At the date of observation
Value
Absolute change
Change from previous value
jan 1, 1962
-7.446
-7.446
0.0%
jan 1, 1963
7.783
+15.228
-204.53%
jan 1, 1964
29.49
+21.707
278.91%
jan 1, 1965
9.747
-19.743
-66.95%
jan 1, 1966
5.465
-4.282
-43.93%
jan 1, 1967
1.66
-3.805
-69.63%
jan 1, 1968
6.372
+4.712
283.87%
jan 1, 1969
3.969
-2.403
-37.72%
jan 1, 1970
-2.125
-6.093
-153.54%
jan 1, 1971
7.91
+10.035
-472.32%
jan 1, 1972
6.41
-1.5
-18.97%
jan 1, 1973
-5.575
-11.985
-186.98%
jan 1, 1974
10.01
+15.585
-279.55%
jan 1, 1975
14.343
+4.333
43.28%
jan 1, 1976
-5.018
-19.361
-134.98%
jan 1, 1977
29.821
+34.839
-694.34%
jan 1, 1978
9.342
-20.48
-68.67%
jan 1, 1979
4.362
-4.98
-53.31%
jan 1, 1980
-7.439
-11.8
-270.54%
jan 1, 1981
-8.616
-1.178
15.83%
jan 1, 1982
-4.102
+4.514
-52.39%
jan 1, 1983
-20.988
-16.885
411.6%
jan 1, 1984
-19.862
+1.126
-5.36%
jan 1, 1985
7.13
+26.992
-135.89%
jan 1, 1986
-12.892
-20.022
-280.83%
jan 1, 1987
-14.56
-1.668
12.94%
jan 1, 1988
47.846
+62.406
-428.62%
jan 1, 1989
3.768
-44.078
-92.12%
jan 1, 1990
5.859
+2.091
55.49%
jan 1, 1991
3.892
-1.967
-33.58%
jan 1, 1992
2.455
-1.436
-36.91%
jan 1, 1993
36.764
+34.309
1.4K%
jan 1, 1994
4.423
-32.341
-87.97%
jan 1, 1995
4.961
+0.538
12.17%
jan 1, 1996
7.591
+2.63
53.0%
jan 1, 1997
-6.861
-14.452
-190.39%
jan 1, 1998
19.503
+26.364
-384.23%
jan 1, 1999
24.501
+4.999
25.63%
jan 1, 2000
0.712
-23.789
-97.09%
jan 1, 2001
6.036
+5.324
747.82%
jan 1, 2002
6.92
+0.884
14.65%
jan 1, 2003
1.986
-4.934
-71.3%
jan 1, 2004
0.537
-1.45
-72.97%
jan 1, 2005
5.684
+5.147
958.73%
jan 1, 2006
-0.572
-6.256
-110.06%
jan 1, 2007
6.45
+7.022
-1.23K%
jan 1, 2008
7.235
+0.785
12.16%
jan 1, 2009
-5.747
-12.982
-179.44%
jan 1, 2010
-7.801
-2.054
35.74%
jan 1, 2011
9.995
+17.796
-228.11%
jan 1, 2012
7.002
-2.993
-29.94%
jan 1, 2013
2.792
-4.21
-60.13%
jan 1, 2014
4.259
+1.467
52.54%
jan 1, 2015
6.967
+2.708
63.6%
jan 1, 2016
8.898
+1.931
27.72%
Ranking of countries by current statistics by years


Comments: