29
/
en
AIzaSyAYiBZKx7MnpbEhh9jyipgxe19OcubqV5w
April 1, 2024
153656
Iceland
ISL
true
2
1
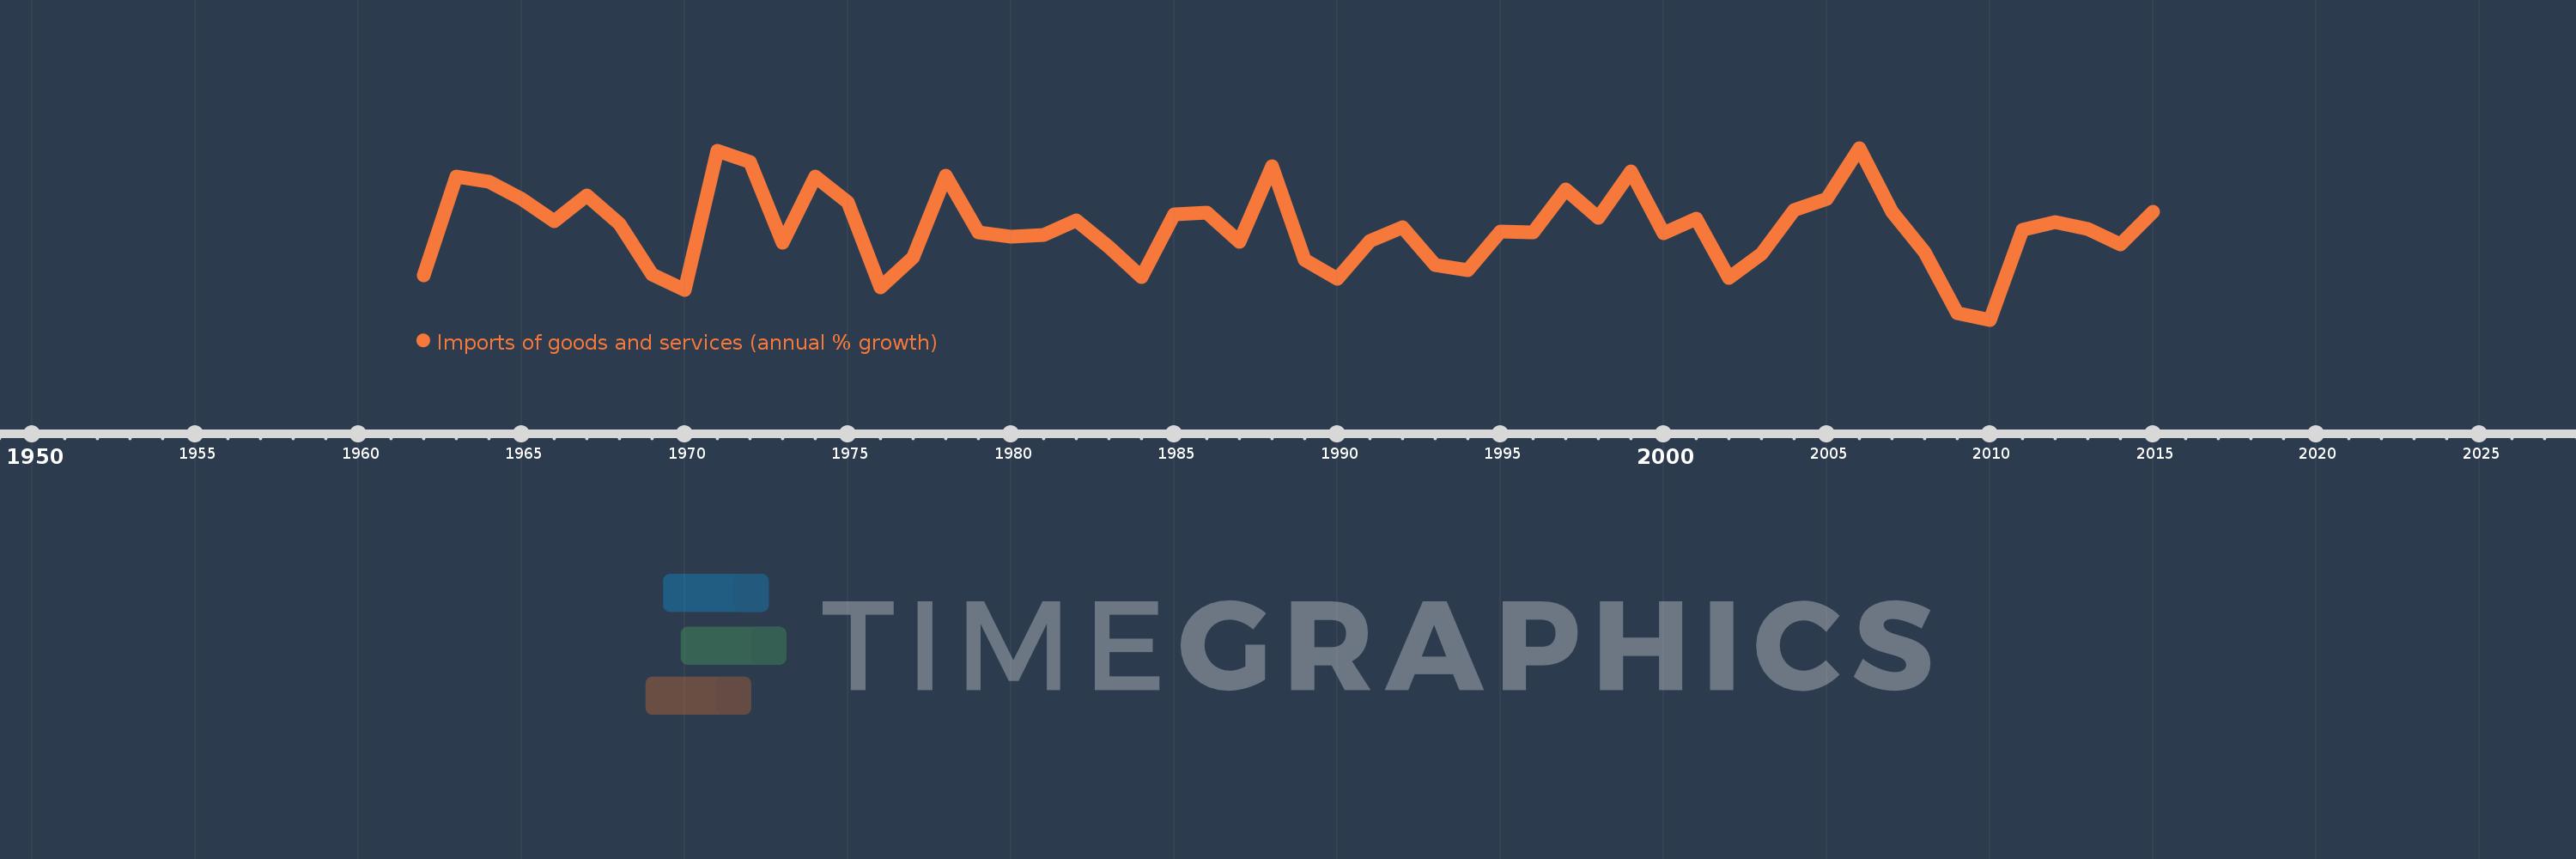
Imports of goods and services (annual % growth)
2015,2014,2013,2012,2011,2010,2009,2008,2007,2006,2005,2004,2003,2002,2001,2000,1999,1998,1997,1996,1995,1994,1993,1992,1991,1990,1989,1988,1987,1986,1985,1984,1983,1982,1981,1980,1979,1978,1977,1976,1975,1974,1973,1972,1971,1970,1969,1968,1967,1966,1965,1964,1963,1962
This statistics in other country:
AlbaniaAlgeriaAngolaAntigua and BarbudaArab WorldArgentinaArmeniaAustraliaAustriaAzerbaijanBahamas, TheBahrainBangladeshBarbadosBelarusBelgiumBelizeBeninBhutanBoliviaBosnia and HerzegovinaBotswanaBrazilBrunei DarussalamBulgariaBurkina FasoBurundiCabo VerdeCambodiaCameroonCanadaCaribbean small statesCentral Europe and the BalticsChadChileColombiaComorosCongo, Dem. Rep.Congo, Rep.Costa RicaCote d'IvoireCroatiaCubaCyprusCzech RepublicDenmarkDjiboutiDominican RepublicEarly-demographic dividendEast Asia & PacificEcuadorEgypt, Arab Rep.El SalvadorEquatorial GuineaEritreaEstoniaEthiopiaEuro areaEurope & Central AsiaEurope & Central Asia (excluding high income)Europe & Central Asia (IDA & IBRD countries)European UnionFijiFinlandFranceGabonGambia, TheGeorgiaGermanyGhanaGreeceGuatemalaGuineaGuinea-BissauHaitiHeavily indebted poor countries (HIPC)High incomeHondurasHong Kong SAR, ChinaHungaryIBRD onlyIcelandIDA & IBRD totalIDA blendIDA onlyIDA totalIndiaIndonesiaIran, Islamic Rep.IrelandIsraelItalyJamaicaJapanJordanKazakhstanKenyaKorea, Rep.KosovoKuwaitKyrgyz RepublicLao PDRLatin America & Caribbean Latin America & Caribbean (excluding high income)Latin America & the Caribbean (IDA & IBRD countries)LatviaLeast developed countries: UN classificationLebanonLiberiaLibyaLithuaniaLow & middle incomeLow incomeLower middle incomeLuxembourgMacao SAR, ChinaMacedonia, FYRMadagascarMalawiMalaysiaMaliMaltaMauritaniaMauritiusMexicoMiddle East & North AfricaMiddle East & North Africa (excluding high income)Middle East & North Africa (IDA & IBRD countries)Middle incomeMoldovaMongoliaMontenegroMoroccoMozambiqueMyanmarNamibiaNepalNetherlandsNew ZealandNicaraguaNigerNigeriaNorth AmericaNorwayOECD membersOmanOther small statesPakistanPanamaPapua New GuineaParaguayPeruPhilippinesPolandPortugalPost-demographic dividendPre-demographic dividendPuerto RicoQatarRomaniaRussian FederationRwandaSamoaSaudi ArabiaSenegalSerbiaSeychellesSierra LeoneSingaporeSlovak RepublicSloveniaSmall statesSomaliaSouth AfricaSouth AsiaSouth Asia (IDA & IBRD)South SudanSpainSri LankaSub-Saharan Africa Sub-Saharan Africa (excluding high income)Sub-Saharan Africa (IDA & IBRD countries)SudanSurinameSwazilandSwedenSwitzerlandSyrian Arab RepublicTajikistanTanzaniaThailandTimor-LesteTogoTrinidad and TobagoTunisiaTurkeyTurkmenistanUgandaUkraineUnited Arab EmiratesUnited KingdomUnited StatesUruguayUzbekistanVanuatuVenezuela, RBVietnamWest Bank and GazaWorldZambiaZimbabwe Timeline:
This timeline shows a graph from 1962 to 2015 of Iceland. No data until 1961. Number of actual observations by date: 54.
Source name:
World Development Indicators
Source organization:
World Bank national accounts data, and OECD National Accounts data files.
Categories, topics:
Economy & Growth, Trade
Last updated:
apr 23, 2017
Indicators value changes by year
Minimum:
-22.369
jan 1, 2010
Maximum:
28.817
jan 1, 2006
At the date of observation
Value
Absolute change
Change from previous value
jan 1, 1962
-9.05
-9.05
0.0%
jan 1, 1963
20.273
+29.323
-324.01%
jan 1, 1964
18.701
-1.572
-7.75%
jan 1, 1965
13.534
-5.166
-27.63%
jan 1, 1966
6.929
-6.605
-48.8%
jan 1, 1967
14.756
+7.826
112.95%
jan 1, 1968
6.314
-8.442
-57.21%
jan 1, 1969
-8.959
-15.273
-241.9%
jan 1, 1970
-13.575
-4.616
51.52%
jan 1, 1971
27.866
+41.44
-305.28%
jan 1, 1972
24.579
-3.287
-11.8%
jan 1, 1973
0.513
-24.065
-97.91%
jan 1, 1974
20.33
+19.816
3.86K%
jan 1, 1975
12.517
-7.813
-38.43%
jan 1, 1976
-12.754
-25.272
-201.89%
jan 1, 1977
-3.648
+9.106
-71.4%
jan 1, 1978
20.58
+24.228
-664.09%
jan 1, 1979
3.641
-16.939
-82.31%
jan 1, 1980
2.466
-1.174
-32.25%
jan 1, 1981
2.991
+0.524
21.25%
jan 1, 1982
7.116
+4.125
137.95%
jan 1, 1983
-0.57
-7.686
-108.01%
jan 1, 1984
-9.695
-9.125
1.6K%
jan 1, 1985
9.145
+18.841
-194.32%
jan 1, 1986
9.419
+0.274
3.0%
jan 1, 1987
0.949
-8.471
-89.93%
jan 1, 1988
23.265
+22.317
2.35K%
jan 1, 1989
-4.585
-27.85
-119.71%
jan 1, 1990
-10.257
-5.672
123.72%
jan 1, 1991
0.991
+11.248
-109.66%
jan 1, 1992
5.259
+4.268
430.74%
jan 1, 1993
-5.972
-11.231
-213.57%
jan 1, 1994
-7.501
-1.529
25.6%
jan 1, 1995
3.822
+11.323
-150.95%
jan 1, 1996
3.618
-0.204
-5.35%
jan 1, 1997
16.474
+12.857
355.41%
jan 1, 1998
8.011
-8.464
-51.37%
jan 1, 1999
21.943
+13.933
173.93%
jan 1, 2000
3.353
-18.59
-84.72%
jan 1, 2001
7.803
+4.45
132.7%
jan 1, 2002
-9.987
-17.79
-227.98%
jan 1, 2003
-2.732
+7.254
-72.64%
jan 1, 2004
10.252
+12.984
-475.22%
jan 1, 2005
13.743
+3.491
34.05%
jan 1, 2006
28.817
+15.074
109.69%
jan 1, 2007
9.821
-18.996
-65.92%
jan 1, 2008
-2.263
-12.083
-123.04%
jan 1, 2009
-20.312
-18.049
797.6%
jan 1, 2010
-22.369
-2.058
10.13%
jan 1, 2011
4.408
+26.778
-119.71%
jan 1, 2012
6.771
+2.362
53.58%
jan 1, 2013
4.605
-2.165
-31.98%
jan 1, 2014
0.187
-4.418
-95.93%
jan 1, 2015
9.842
+9.655
5.15K%
Ranking of countries by current statistics by years


Comments: