29
/
en
AIzaSyAYiBZKx7MnpbEhh9jyipgxe19OcubqV5w
April 1, 2024
248841
Sri Lanka
LKA
true
2
1
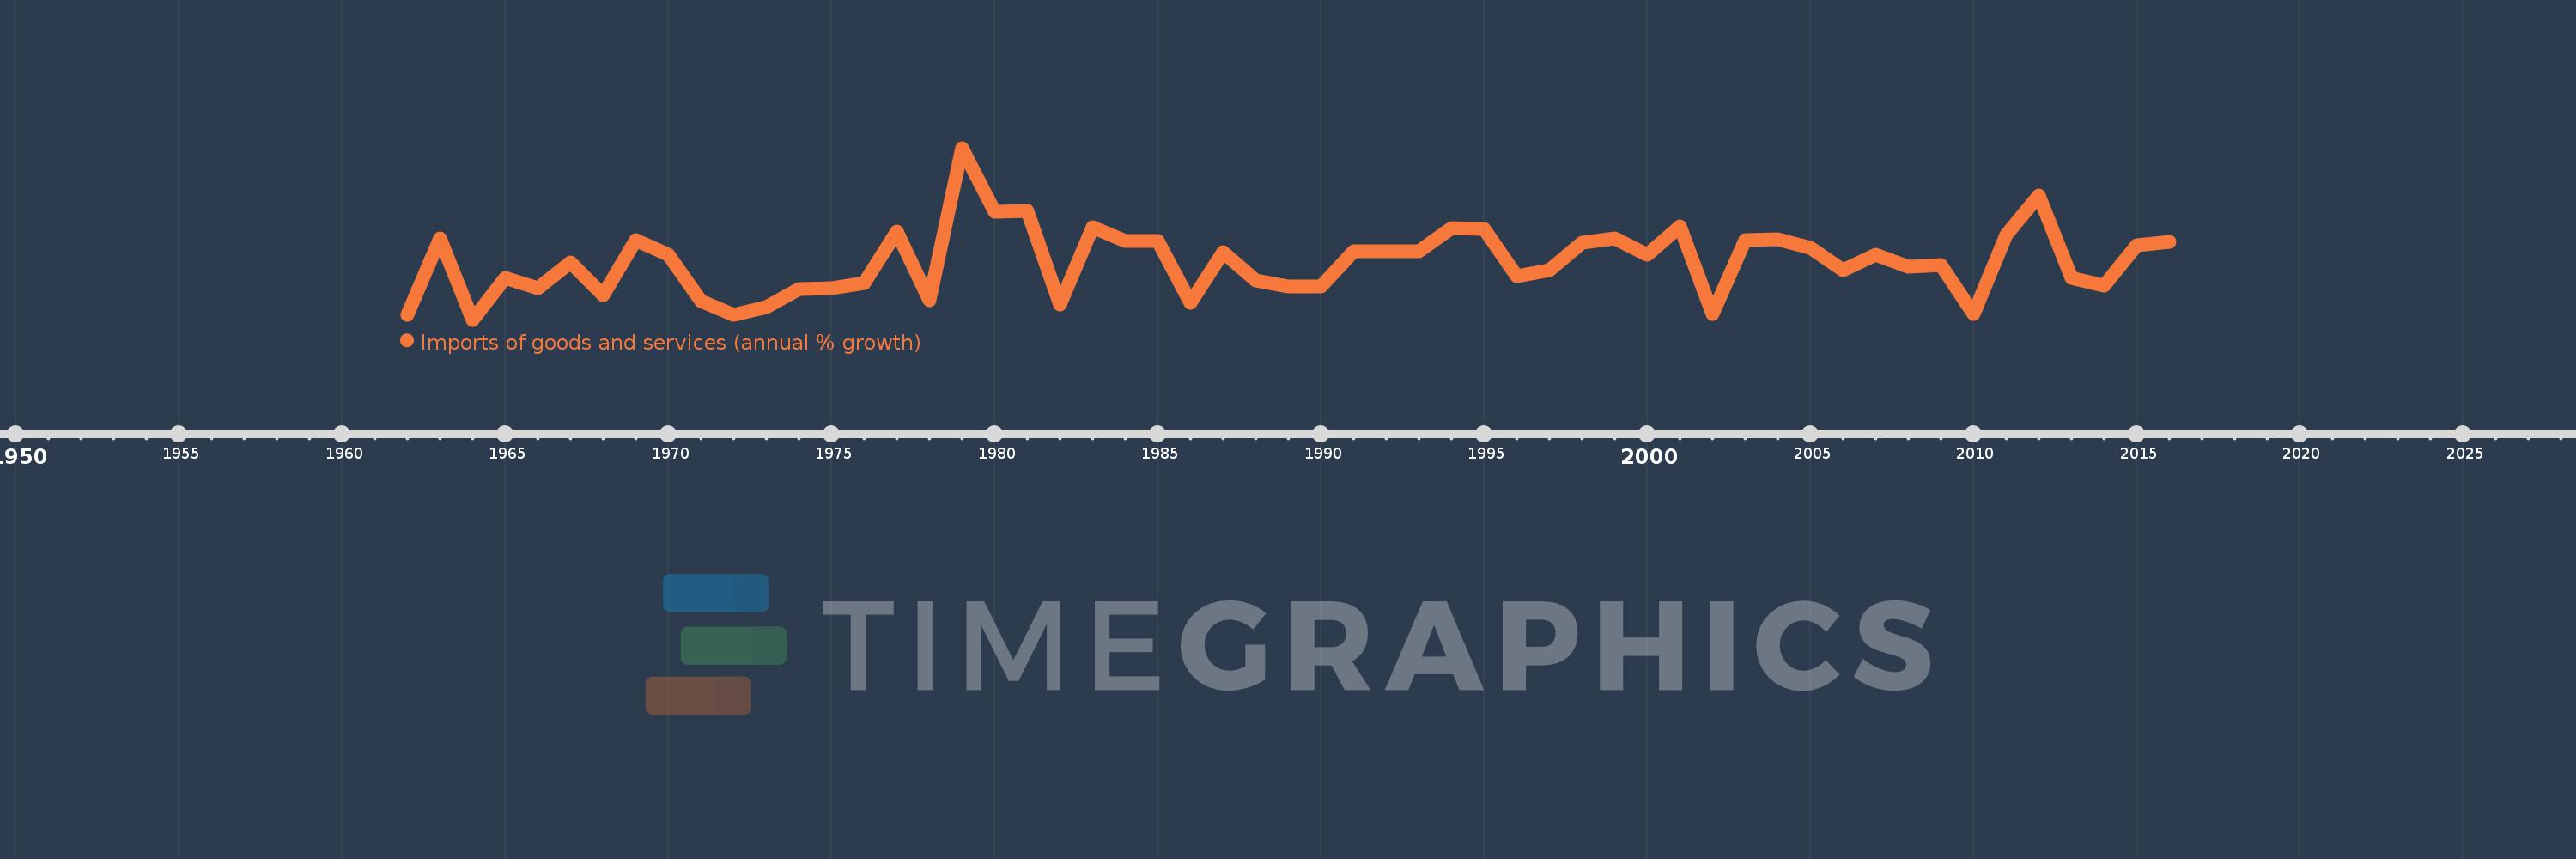
Imports of goods and services (annual % growth)
2016,2015,2014,2013,2012,2011,2010,2009,2008,2007,2006,2005,2004,2003,2002,2001,2000,1999,1998,1997,1996,1995,1994,1993,1992,1991,1990,1989,1988,1987,1986,1985,1984,1983,1982,1981,1980,1979,1978,1977,1976,1975,1974,1973,1972,1971,1970,1969,1968,1967,1966,1965,1964,1963,1962
This statistics in other country:
AlbaniaAlgeriaAngolaAntigua and BarbudaArab WorldArgentinaArmeniaAustraliaAustriaAzerbaijanBahamas, TheBahrainBangladeshBarbadosBelarusBelgiumBelizeBeninBhutanBoliviaBosnia and HerzegovinaBotswanaBrazilBrunei DarussalamBulgariaBurkina FasoBurundiCabo VerdeCambodiaCameroonCanadaCaribbean small statesCentral Europe and the BalticsChadChileColombiaComorosCongo, Dem. Rep.Congo, Rep.Costa RicaCote d'IvoireCroatiaCubaCyprusCzech RepublicDenmarkDjiboutiDominican RepublicEarly-demographic dividendEast Asia & PacificEcuadorEgypt, Arab Rep.El SalvadorEquatorial GuineaEritreaEstoniaEthiopiaEuro areaEurope & Central AsiaEurope & Central Asia (excluding high income)Europe & Central Asia (IDA & IBRD countries)European UnionFijiFinlandFranceGabonGambia, TheGeorgiaGermanyGhanaGreeceGuatemalaGuineaGuinea-BissauHaitiHeavily indebted poor countries (HIPC)High incomeHondurasHong Kong SAR, ChinaHungaryIBRD onlyIcelandIDA & IBRD totalIDA blendIDA onlyIDA totalIndiaIndonesiaIran, Islamic Rep.IrelandIsraelItalyJamaicaJapanJordanKazakhstanKenyaKorea, Rep.KosovoKuwaitKyrgyz RepublicLao PDRLatin America & Caribbean Latin America & Caribbean (excluding high income)Latin America & the Caribbean (IDA & IBRD countries)LatviaLeast developed countries: UN classificationLebanonLiberiaLibyaLithuaniaLow & middle incomeLow incomeLower middle incomeLuxembourgMacao SAR, ChinaMacedonia, FYRMadagascarMalawiMalaysiaMaliMaltaMauritaniaMauritiusMexicoMiddle East & North AfricaMiddle East & North Africa (excluding high income)Middle East & North Africa (IDA & IBRD countries)Middle incomeMoldovaMongoliaMontenegroMoroccoMozambiqueMyanmarNamibiaNepalNetherlandsNew ZealandNicaraguaNigerNigeriaNorth AmericaNorwayOECD membersOmanOther small statesPakistanPanamaPapua New GuineaParaguayPeruPhilippinesPolandPortugalPost-demographic dividendPre-demographic dividendPuerto RicoQatarRomaniaRussian FederationRwandaSamoaSaudi ArabiaSenegalSerbiaSeychellesSierra LeoneSingaporeSlovak RepublicSloveniaSmall statesSomaliaSouth AfricaSouth AsiaSouth Asia (IDA & IBRD)South SudanSpainSri LankaSub-Saharan Africa Sub-Saharan Africa (excluding high income)Sub-Saharan Africa (IDA & IBRD countries)SudanSurinameSwazilandSwedenSwitzerlandSyrian Arab RepublicTajikistanTanzaniaThailandTimor-LesteTogoTrinidad and TobagoTunisiaTurkeyTurkmenistanUgandaUkraineUnited Arab EmiratesUnited KingdomUnited StatesUruguayUzbekistanVanuatuVenezuela, RBVietnamWest Bank and GazaWorldZambiaZimbabwe Timeline:
This timeline shows a graph from 1962 to 2016 of Sri Lanka. No data until 1961. Number of actual observations by date: 55.
Source name:
World Development Indicators
Source organization:
World Bank national accounts data, and OECD National Accounts data files.
Categories, topics:
Economy & Growth, Trade
Last updated:
apr 23, 2017
Indicators value changes by year
Minimum:
-11.202
jan 1, 1964
Maximum:
36.919
jan 1, 1979
At the date of observation
Value
Absolute change
Change from previous value
jan 1, 1962
-9.884
-9.884
0.0%
jan 1, 1963
11.649
+21.533
-217.85%
jan 1, 1964
-11.202
-22.851
-196.16%
jan 1, 1965
0.435
+11.637
-103.88%
jan 1, 1966
-2.255
-2.69
-618.7%
jan 1, 1967
4.769
+7.024
-311.42%
jan 1, 1968
-4.369
-9.137
-191.61%
jan 1, 1969
11.01
+15.378
-352.03%
jan 1, 1970
7.101
-3.909
-35.5%
jan 1, 1971
-5.914
-13.015
-183.27%
jan 1, 1972
-9.825
-3.912
66.15%
jan 1, 1973
-7.757
+2.068
-21.05%
jan 1, 1974
-2.553
+5.204
-67.09%
jan 1, 1975
-2.386
+0.168
-6.56%
jan 1, 1976
-0.833
+1.552
-65.07%
jan 1, 1977
13.597
+14.431
-1.73K%
jan 1, 1978
-5.688
-19.285
-141.83%
jan 1, 1979
36.919
+42.606
-749.11%
jan 1, 1980
18.947
-17.972
-48.68%
jan 1, 1981
19.25
+0.303
1.6%
jan 1, 1982
-6.974
-26.224
-136.23%
jan 1, 1983
14.652
+21.626
-310.09%
jan 1, 1984
10.786
-3.866
-26.38%
jan 1, 1985
10.764
-0.021
-0.2%
jan 1, 1986
-6.487
-17.252
-160.27%
jan 1, 1987
7.681
+14.168
-218.39%
jan 1, 1988
-0.271
-7.952
-103.53%
jan 1, 1989
-2.001
-1.73
637.09%
jan 1, 1990
-2.001
+0.001
-0.03%
jan 1, 1991
7.9
+9.901
-494.9%
jan 1, 1994
14.5
+6.6
83.54%
jan 1, 1995
14.2
-0.3
-2.07%
jan 1, 1996
1.0
-13.2
-92.96%
jan 1, 1997
2.8
+1.8
180.0%
jan 1, 1998
10.469
+7.669
273.88%
jan 1, 1999
11.49
+1.021
9.76%
jan 1, 2000
7.007
-4.483
-39.02%
jan 1, 2001
14.888
+7.881
112.48%
jan 1, 2002
-9.528
-24.416
-164.0%
jan 1, 2003
11.217
+20.745
-217.73%
jan 1, 2004
11.247
+0.03
0.26%
jan 1, 2005
9.011
-2.236
-19.88%
jan 1, 2006
2.688
-6.323
-70.17%
jan 1, 2007
6.937
+4.249
158.06%
jan 1, 2008
3.733
-3.204
-46.19%
jan 1, 2009
4.012
+0.279
7.46%
jan 1, 2010
-9.586
-13.598
-338.94%
jan 1, 2011
12.647
+22.233
-231.93%
jan 1, 2012
23.6
+10.953
86.6%
jan 1, 2013
0.485
-23.115
-97.94%
jan 1, 2014
-1.53
-2.015
-415.13%
jan 1, 2015
9.567
+11.096
-725.35%
jan 1, 2016
10.597
+1.03
10.77%
Ranking of countries by current statistics by years


Comments: