29
/
en
AIzaSyAYiBZKx7MnpbEhh9jyipgxe19OcubqV5w
April 1, 2024
187912
Malaysia
MYS
true
2
1
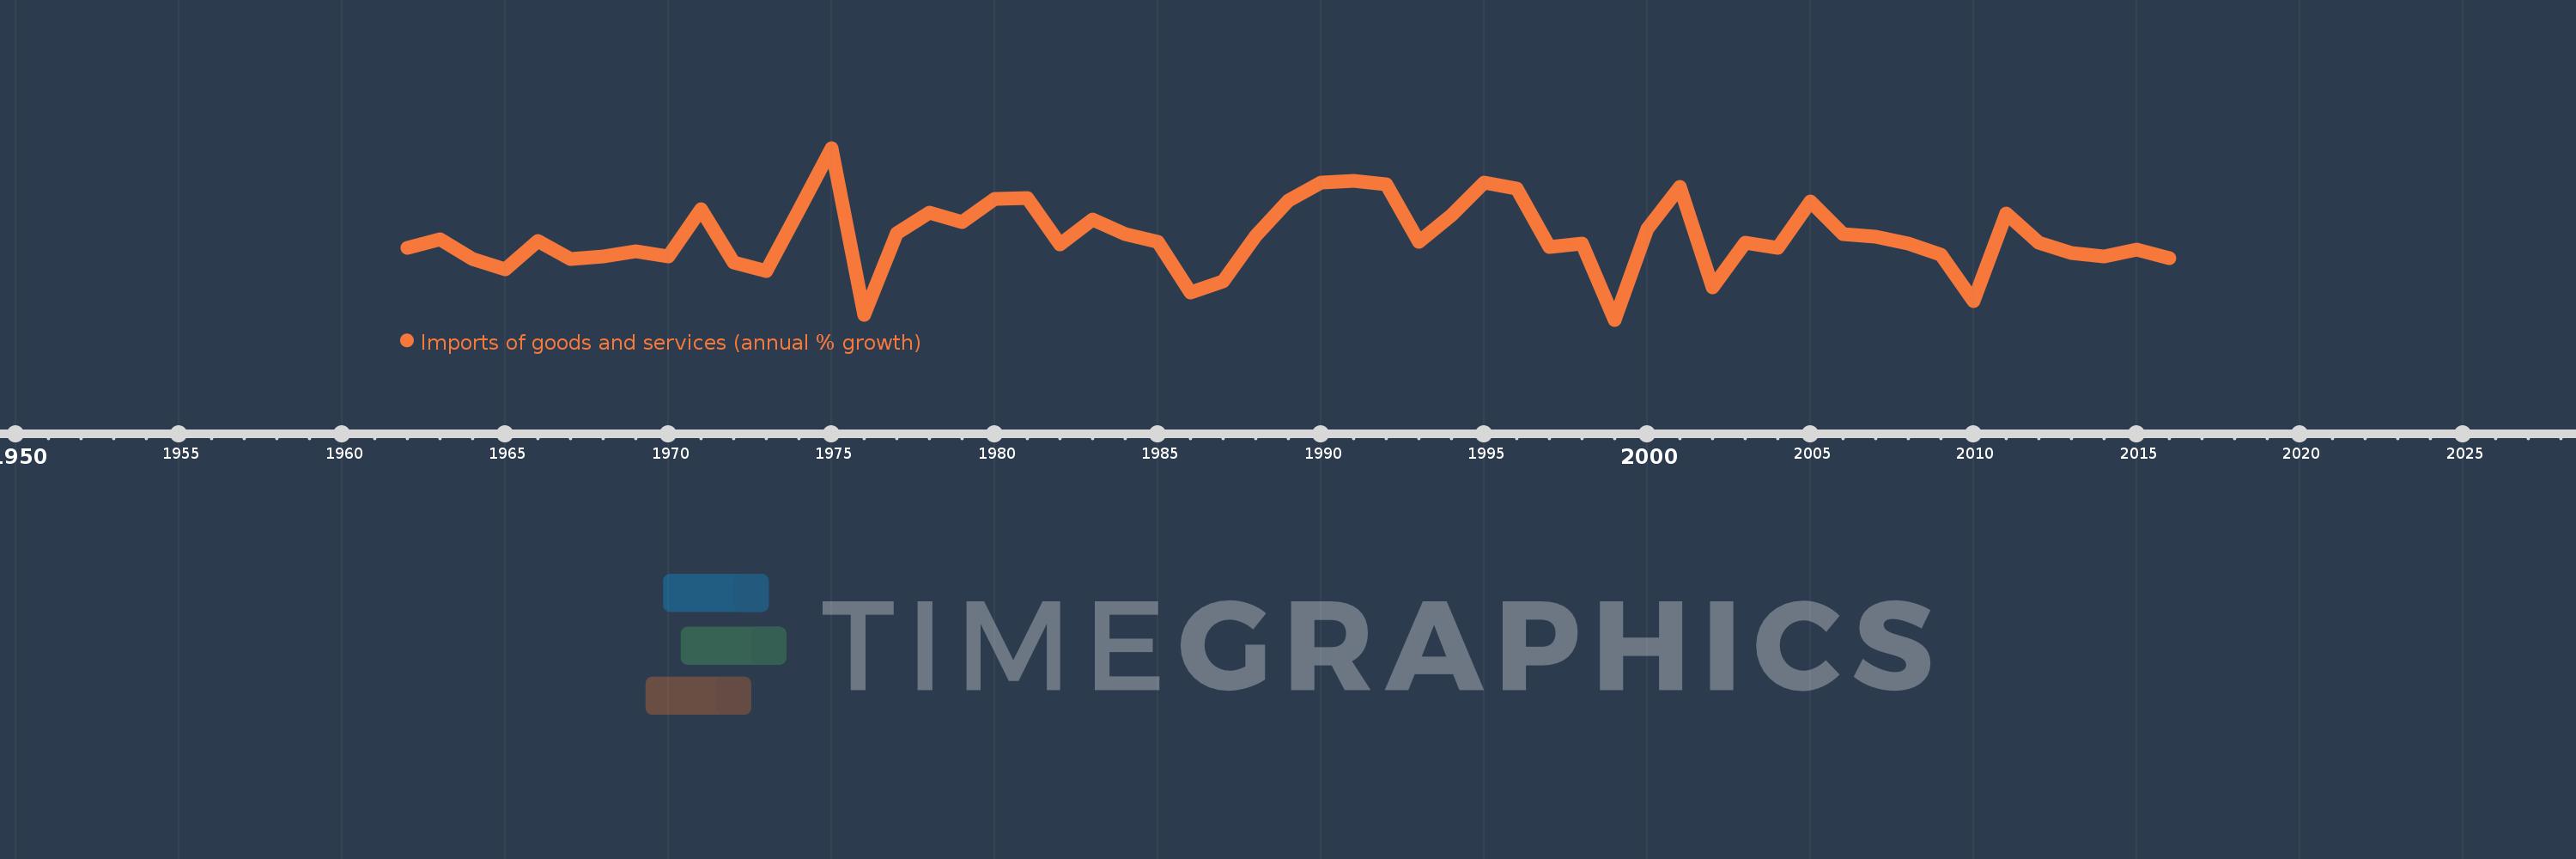
Imports of goods and services (annual % growth)
2016,2015,2014,2013,2012,2011,2010,2009,2008,2007,2006,2005,2004,2003,2002,2001,2000,1999,1998,1997,1996,1995,1994,1993,1992,1991,1990,1989,1988,1987,1986,1985,1984,1983,1982,1981,1980,1979,1978,1977,1976,1975,1974,1973,1972,1971,1970,1969,1968,1967,1966,1965,1964,1963,1962
This statistics in other country:
AlbaniaAlgeriaAngolaAntigua and BarbudaArab WorldArgentinaArmeniaAustraliaAustriaAzerbaijanBahamas, TheBahrainBangladeshBarbadosBelarusBelgiumBelizeBeninBhutanBoliviaBosnia and HerzegovinaBotswanaBrazilBrunei DarussalamBulgariaBurkina FasoBurundiCabo VerdeCambodiaCameroonCanadaCaribbean small statesCentral Europe and the BalticsChadChileColombiaComorosCongo, Dem. Rep.Congo, Rep.Costa RicaCote d'IvoireCroatiaCubaCyprusCzech RepublicDenmarkDjiboutiDominican RepublicEarly-demographic dividendEast Asia & PacificEcuadorEgypt, Arab Rep.El SalvadorEquatorial GuineaEritreaEstoniaEthiopiaEuro areaEurope & Central AsiaEurope & Central Asia (excluding high income)Europe & Central Asia (IDA & IBRD countries)European UnionFijiFinlandFranceGabonGambia, TheGeorgiaGermanyGhanaGreeceGuatemalaGuineaGuinea-BissauHaitiHeavily indebted poor countries (HIPC)High incomeHondurasHong Kong SAR, ChinaHungaryIBRD onlyIcelandIDA & IBRD totalIDA blendIDA onlyIDA totalIndiaIndonesiaIran, Islamic Rep.IrelandIsraelItalyJamaicaJapanJordanKazakhstanKenyaKorea, Rep.KosovoKuwaitKyrgyz RepublicLao PDRLatin America & Caribbean Latin America & Caribbean (excluding high income)Latin America & the Caribbean (IDA & IBRD countries)LatviaLeast developed countries: UN classificationLebanonLiberiaLibyaLithuaniaLow & middle incomeLow incomeLower middle incomeLuxembourgMacao SAR, ChinaMacedonia, FYRMadagascarMalawiMalaysiaMaliMaltaMauritaniaMauritiusMexicoMiddle East & North AfricaMiddle East & North Africa (excluding high income)Middle East & North Africa (IDA & IBRD countries)Middle incomeMoldovaMongoliaMontenegroMoroccoMozambiqueMyanmarNamibiaNepalNetherlandsNew ZealandNicaraguaNigerNigeriaNorth AmericaNorwayOECD membersOmanOther small statesPakistanPanamaPapua New GuineaParaguayPeruPhilippinesPolandPortugalPost-demographic dividendPre-demographic dividendPuerto RicoQatarRomaniaRussian FederationRwandaSamoaSaudi ArabiaSenegalSerbiaSeychellesSierra LeoneSingaporeSlovak RepublicSloveniaSmall statesSomaliaSouth AfricaSouth AsiaSouth Asia (IDA & IBRD)South SudanSpainSri LankaSub-Saharan Africa Sub-Saharan Africa (excluding high income)Sub-Saharan Africa (IDA & IBRD countries)SudanSurinameSwazilandSwedenSwitzerlandSyrian Arab RepublicTajikistanTanzaniaThailandTimor-LesteTogoTrinidad and TobagoTunisiaTurkeyTurkmenistanUgandaUkraineUnited Arab EmiratesUnited KingdomUnited StatesUruguayUzbekistanVanuatuVenezuela, RBVietnamWest Bank and GazaWorldZambiaZimbabwe Timeline:
This timeline shows a graph from 1962 to 2016 of Malaysia. No data until 1961. Number of actual observations by date: 55.
Source name:
World Development Indicators
Source organization:
World Bank national accounts data, and OECD National Accounts data files.
Categories, topics:
Economy & Growth, Trade
Last updated:
apr 23, 2017
Indicators value changes by year
Minimum:
-18.754
jan 1, 1999
Maximum:
36.831
jan 1, 1975
At the date of observation
Value
Absolute change
Change from previous value
jan 1, 1962
4.586
+4.586
0.0%
jan 1, 1963
7.319
+2.733
59.59%
jan 1, 1964
0.911
-6.407
-87.55%
jan 1, 1965
-2.563
-3.475
-381.31%
jan 1, 1966
6.652
+9.215
-359.49%
jan 1, 1967
0.967
-5.685
-85.46%
jan 1, 1968
1.791
+0.824
85.17%
jan 1, 1969
3.368
+1.578
88.1%
jan 1, 1970
1.609
-1.759
-52.22%
jan 1, 1971
17.099
+15.49
962.41%
jan 1, 1972
-0.244
-17.343
-101.43%
jan 1, 1973
-3.023
-2.779
1.14K%
jan 1, 1974
16.665
+19.688
-651.22%
jan 1, 1975
36.831
+20.166
121.01%
jan 1, 1976
-17.095
-53.926
-146.42%
jan 1, 1977
9.189
+26.284
-153.75%
jan 1, 1978
15.784
+6.595
71.78%
jan 1, 1979
12.872
-2.912
-18.45%
jan 1, 1980
20.435
+7.563
58.76%
jan 1, 1981
20.51
+0.075
0.37%
jan 1, 1982
5.591
-14.919
-72.74%
jan 1, 1983
13.754
+8.163
146.01%
jan 1, 1984
9.003
-4.751
-34.54%
jan 1, 1985
6.506
-2.497
-27.74%
jan 1, 1986
-9.836
-16.342
-251.19%
jan 1, 1987
-6.469
+3.367
-34.23%
jan 1, 1988
8.474
+14.943
-230.99%
jan 1, 1989
19.715
+11.241
132.66%
jan 1, 1990
25.701
+5.987
30.37%
jan 1, 1991
26.286
+0.584
2.27%
jan 1, 1992
25.209
-1.076
-4.09%
jan 1, 1993
6.374
-18.835
-74.72%
jan 1, 1994
15.035
+8.661
135.89%
jan 1, 1995
25.636
+10.6
70.5%
jan 1, 1996
23.698
-1.938
-7.56%
jan 1, 1997
4.886
-18.813
-79.38%
jan 1, 1998
5.825
+0.939
19.22%
jan 1, 1999
-18.754
-24.578
-421.98%
jan 1, 2000
10.563
+29.317
-156.33%
jan 1, 2001
24.375
+13.811
130.75%
jan 1, 2002
-8.235
-32.61
-133.79%
jan 1, 2003
6.186
+14.421
-175.12%
jan 1, 2004
4.534
-1.652
-26.71%
jan 1, 2005
19.636
+15.103
333.11%
jan 1, 2006
8.911
-10.726
-54.62%
jan 1, 2007
8.17
-0.741
-8.31%
jan 1, 2008
6.026
-2.144
-26.24%
jan 1, 2009
2.339
-3.687
-61.18%
jan 1, 2010
-12.731
-15.071
-644.26%
jan 1, 2011
15.523
+28.254
-221.93%
jan 1, 2012
6.31
-9.213
-59.35%
jan 1, 2013
2.912
-3.398
-53.85%
jan 1, 2014
1.724
-1.188
-40.81%
jan 1, 2015
3.989
+2.265
131.42%
jan 1, 2016
1.249
-2.74
-68.7%
Ranking of countries by current statistics by years


Comments: