29
/
en
AIzaSyAYiBZKx7MnpbEhh9jyipgxe19OcubqV5w
April 1, 2024
135645
Gabon
GAB
true
2
1
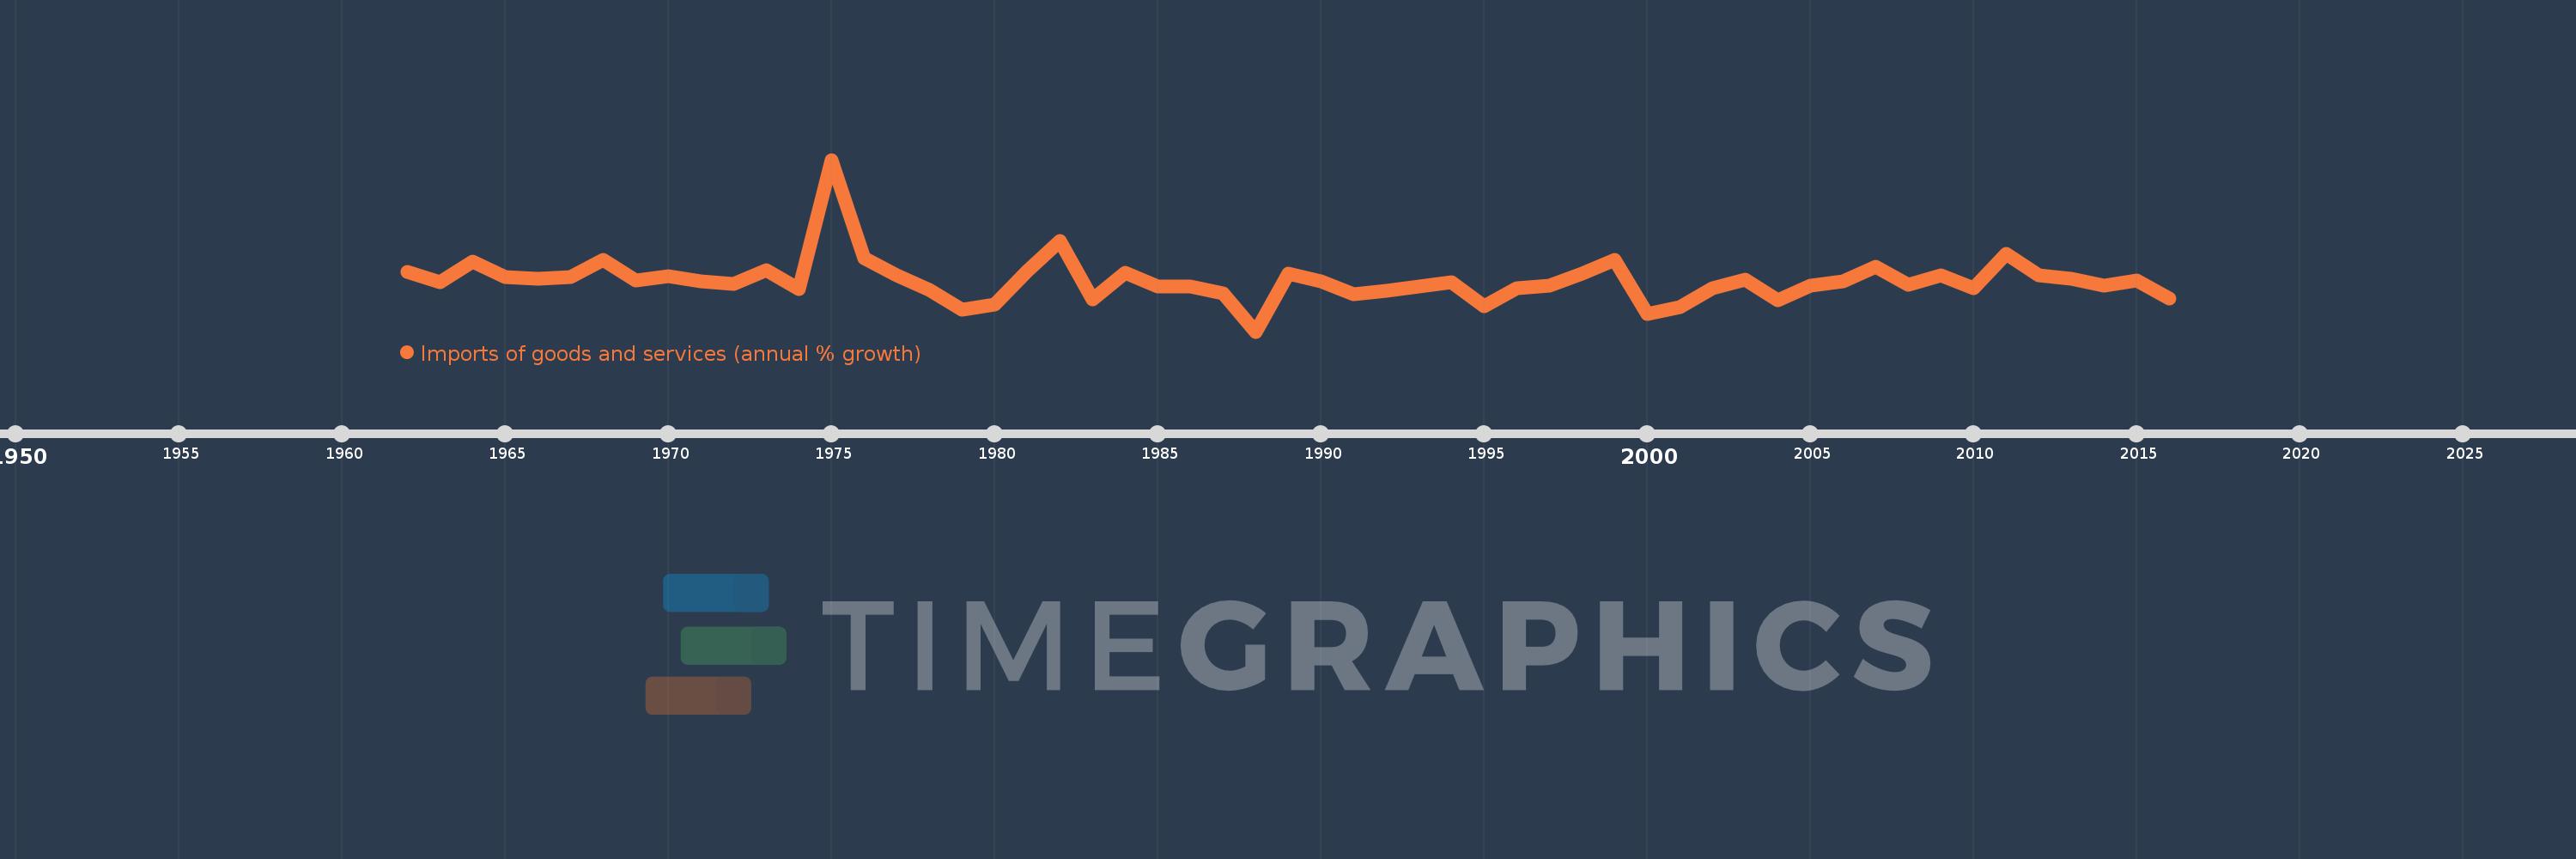
Imports of goods and services (annual % growth)
2016,2015,2014,2013,2012,2011,2010,2009,2008,2007,2006,2005,2004,2003,2002,2001,2000,1999,1998,1997,1996,1995,1994,1993,1992,1991,1990,1989,1988,1987,1986,1985,1984,1983,1982,1981,1980,1979,1978,1977,1976,1975,1974,1973,1972,1971,1970,1969,1968,1967,1966,1965,1964,1963,1962
This statistics in other country:
AlbaniaAlgeriaAngolaAntigua and BarbudaArab WorldArgentinaArmeniaAustraliaAustriaAzerbaijanBahamas, TheBahrainBangladeshBarbadosBelarusBelgiumBelizeBeninBhutanBoliviaBosnia and HerzegovinaBotswanaBrazilBrunei DarussalamBulgariaBurkina FasoBurundiCabo VerdeCambodiaCameroonCanadaCaribbean small statesCentral Europe and the BalticsChadChileColombiaComorosCongo, Dem. Rep.Congo, Rep.Costa RicaCote d'IvoireCroatiaCubaCyprusCzech RepublicDenmarkDjiboutiDominican RepublicEarly-demographic dividendEast Asia & PacificEcuadorEgypt, Arab Rep.El SalvadorEquatorial GuineaEritreaEstoniaEthiopiaEuro areaEurope & Central AsiaEurope & Central Asia (excluding high income)Europe & Central Asia (IDA & IBRD countries)European UnionFijiFinlandFranceGabonGambia, TheGeorgiaGermanyGhanaGreeceGuatemalaGuineaGuinea-BissauHaitiHeavily indebted poor countries (HIPC)High incomeHondurasHong Kong SAR, ChinaHungaryIBRD onlyIcelandIDA & IBRD totalIDA blendIDA onlyIDA totalIndiaIndonesiaIran, Islamic Rep.IrelandIsraelItalyJamaicaJapanJordanKazakhstanKenyaKorea, Rep.KosovoKuwaitKyrgyz RepublicLao PDRLatin America & Caribbean Latin America & Caribbean (excluding high income)Latin America & the Caribbean (IDA & IBRD countries)LatviaLeast developed countries: UN classificationLebanonLiberiaLibyaLithuaniaLow & middle incomeLow incomeLower middle incomeLuxembourgMacao SAR, ChinaMacedonia, FYRMadagascarMalawiMalaysiaMaliMaltaMauritaniaMauritiusMexicoMiddle East & North AfricaMiddle East & North Africa (excluding high income)Middle East & North Africa (IDA & IBRD countries)Middle incomeMoldovaMongoliaMontenegroMoroccoMozambiqueMyanmarNamibiaNepalNetherlandsNew ZealandNicaraguaNigerNigeriaNorth AmericaNorwayOECD membersOmanOther small statesPakistanPanamaPapua New GuineaParaguayPeruPhilippinesPolandPortugalPost-demographic dividendPre-demographic dividendPuerto RicoQatarRomaniaRussian FederationRwandaSamoaSaudi ArabiaSenegalSerbiaSeychellesSierra LeoneSingaporeSlovak RepublicSloveniaSmall statesSomaliaSouth AfricaSouth AsiaSouth Asia (IDA & IBRD)South SudanSpainSri LankaSub-Saharan Africa Sub-Saharan Africa (excluding high income)Sub-Saharan Africa (IDA & IBRD countries)SudanSurinameSwazilandSwedenSwitzerlandSyrian Arab RepublicTajikistanTanzaniaThailandTimor-LesteTogoTrinidad and TobagoTunisiaTurkeyTurkmenistanUgandaUkraineUnited Arab EmiratesUnited KingdomUnited StatesUruguayUzbekistanVanuatuVenezuela, RBVietnamWest Bank and GazaWorldZambiaZimbabwe Timeline:
This timeline shows a graph from 1962 to 2016 of Gabon. No data until 1961. Number of actual observations by date: 55.
Source name:
World Development Indicators
Source organization:
World Bank national accounts data, and OECD National Accounts data files.
Categories, topics:
Economy & Growth, Trade
Last updated:
apr 23, 2017
Indicators value changes by year
Minimum:
-39.231
jan 1, 1988
Maximum:
117.962
jan 1, 1975
At the date of observation
Value
Absolute change
Change from previous value
jan 1, 1962
15.026
+15.026
0.0%
jan 1, 1963
5.856
-9.17
-61.03%
jan 1, 1964
24.681
+18.825
321.47%
jan 1, 1965
10.58
-14.101
-57.13%
jan 1, 1966
8.951
-1.63
-15.4%
jan 1, 1967
10.567
+1.616
18.06%
jan 1, 1968
26.549
+15.982
151.24%
jan 1, 1969
7.552
-18.997
-71.55%
jan 1, 1970
11.183
+3.631
48.08%
jan 1, 1971
7.134
-4.049
-36.21%
jan 1, 1972
4.258
-2.877
-40.32%
jan 1, 1973
17.173
+12.916
303.36%
jan 1, 1974
0.0
-17.173
-100.0%
jan 1, 1975
117.962
+117.962
%
jan 1, 1976
28.208
-89.753
-76.09%
jan 1, 1977
12.536
-15.672
-55.56%
jan 1, 1978
-1.165
-13.701
-109.29%
jan 1, 1979
-18.804
-17.639
1.51K%
jan 1, 1980
-14.625
+4.179
-22.23%
jan 1, 1981
16.134
+30.759
-210.32%
jan 1, 1982
43.711
+27.577
170.92%
jan 1, 1983
-9.55
-53.261
-121.85%
jan 1, 1984
14.739
+24.29
-254.33%
jan 1, 1985
1.7
-13.039
-88.46%
jan 1, 1986
1.871
+0.171
10.03%
jan 1, 1987
-4.155
-6.025
-322.09%
jan 1, 1988
-39.231
-35.076
844.25%
jan 1, 1989
13.618
+52.849
-134.71%
jan 1, 1990
6.81
-6.808
-50.0%
jan 1, 1991
-4.717
-11.527
-169.27%
jan 1, 1992
-1.929
+2.788
-59.1%
jan 1, 1993
1.87
+3.799
-196.95%
jan 1, 1994
5.815
+3.945
210.92%
jan 1, 1995
-16.103
-21.919
-376.92%
jan 1, 1996
0.711
+16.815
-104.42%
jan 1, 1997
2.44
+1.729
242.94%
jan 1, 1998
13.956
+11.516
471.98%
jan 1, 1999
26.055
+12.099
86.69%
jan 1, 2000
-23.323
-49.378
-189.51%
jan 1, 2001
-16.478
+6.845
-29.35%
jan 1, 2002
0.387
+16.865
-102.35%
jan 1, 2003
8.175
+7.788
2.01K%
jan 1, 2004
-10.657
-18.832
-230.37%
jan 1, 2005
2.686
+13.343
-125.2%
jan 1, 2006
6.67
+3.984
148.34%
jan 1, 2007
20.001
+13.331
199.85%
jan 1, 2008
3.645
-16.356
-81.77%
jan 1, 2009
12.507
+8.862
243.09%
jan 1, 2010
0.132
-12.376
-98.95%
jan 1, 2011
31.588
+31.456
23.87K%
jan 1, 2012
12.496
-19.093
-60.44%
jan 1, 2013
9.146
-3.35
-26.81%
jan 1, 2014
2.545
-6.601
-72.17%
jan 1, 2015
7.868
+5.322
209.1%
jan 1, 2016
-9.297
-17.165
-218.17%
Ranking of countries by current statistics by years


Comments: