29
/
en
AIzaSyAYiBZKx7MnpbEhh9jyipgxe19OcubqV5w
April 1, 2024
63209
Afghanistan
AFG
true
2
1
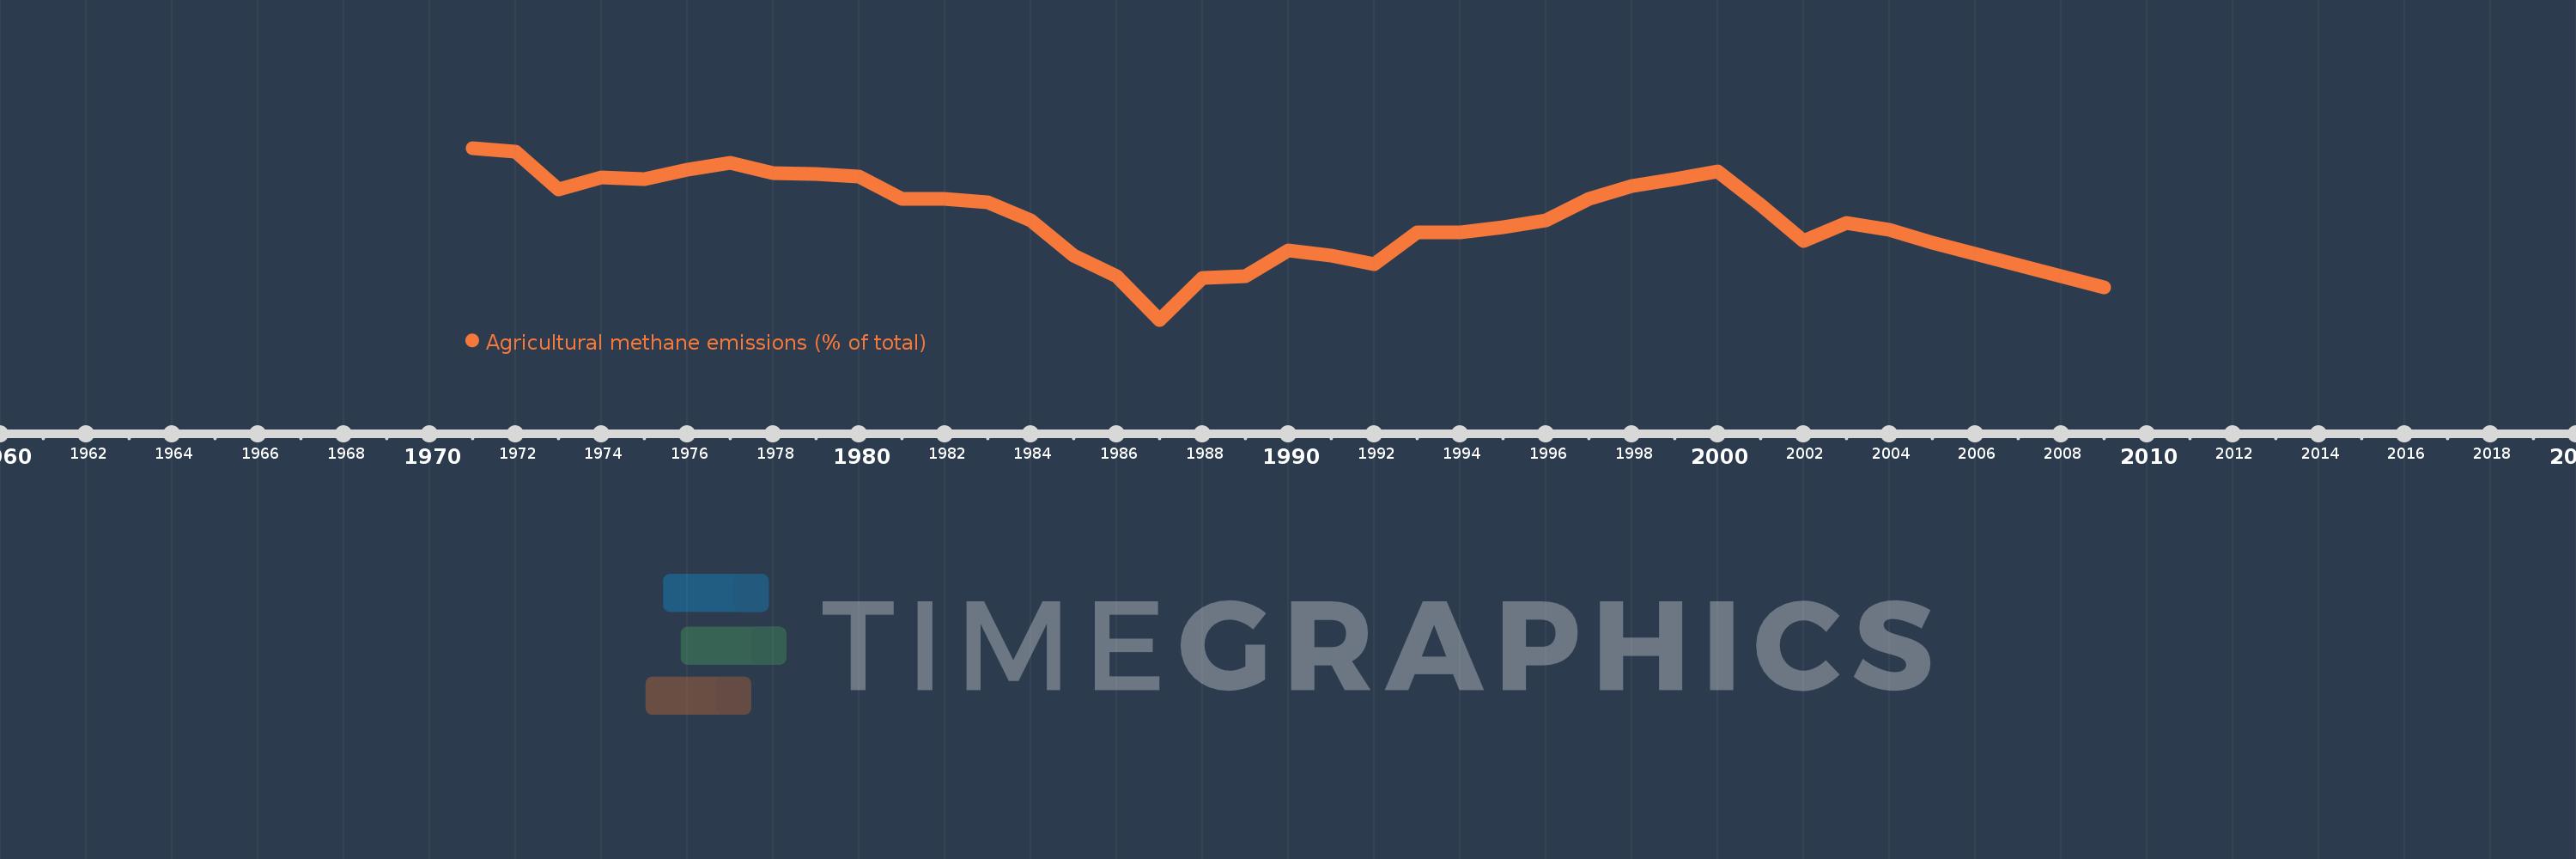
Agricultural methane emissions (% of total)
2009,2008,2007,2006,2005,2004,2003,2002,2001,2000,1999,1998,1997,1996,1995,1994,1993,1992,1991,1990,1989,1988,1987,1986,1985,1984,1983,1982,1981,1980,1979,1978,1977,1976,1975,1974,1973,1972,1971
This statistics in other country:
AfghanistanAlbaniaAlgeriaAmerican SamoaAngolaAntigua and BarbudaArab WorldArgentinaArmeniaArubaAustraliaAustriaAzerbaijanBahamas, TheBahrainBangladeshBarbadosBelarusBelgiumBelizeBeninBermudaBhutanBoliviaBosnia and HerzegovinaBotswanaBrazilBritish Virgin IslandsBrunei DarussalamBulgariaBurkina FasoBurundiCabo VerdeCambodiaCameroonCanadaCaribbean small statesCayman IslandsCentral African RepublicCentral Europe and the BalticsChadChileChinaColombiaComorosCongo, Dem. Rep.Congo, Rep.Costa RicaCote d'IvoireCroatiaCubaCyprusCzech RepublicDenmarkDjiboutiDominicaDominican RepublicEarly-demographic dividendEast Asia & PacificEast Asia & Pacific (excluding high income)East Asia & Pacific (IDA & IBRD countries)EcuadorEgypt, Arab Rep.El SalvadorEquatorial GuineaEritreaEstoniaEthiopiaEuro areaEurope & Central AsiaEurope & Central Asia (excluding high income)Europe & Central Asia (IDA & IBRD countries)European UnionFaroe IslandsFijiFinlandFragile and conflict affected situationsFranceFrench PolynesiaGabonGambia, TheGeorgiaGermanyGhanaGibraltarGreeceGreenlandGrenadaGuamGuatemalaGuineaGuinea-BissauGuyanaHaitiHeavily indebted poor countries (HIPC)High incomeHondurasHong Kong SAR, ChinaHungaryIBRD onlyIcelandIDA & IBRD totalIDA blendIDA onlyIDA totalIndiaIndonesiaIran, Islamic Rep.IraqIrelandIsraelItalyJamaicaJapanJordanKazakhstanKenyaKiribatiKorea, Dem. People’s Rep.Korea, Rep.KuwaitKyrgyz RepublicLao PDRLate-demographic dividendLatin America & Caribbean Latin America & Caribbean (excluding high income)Latin America & the Caribbean (IDA & IBRD countries)LatviaLeast developed countries: UN classificationLebanonLesothoLiberiaLibyaLithuaniaLow & middle incomeLow incomeLower middle incomeLuxembourgMacao SAR, ChinaMacedonia, FYRMadagascarMalawiMalaysiaMaldivesMaliMaltaMarshall IslandsMauritaniaMauritiusMexicoMicronesia, Fed. Sts.Middle East & North AfricaMiddle East & North Africa (excluding high income)Middle East & North Africa (IDA & IBRD countries)Middle incomeMoldovaMongoliaMoroccoMozambiqueMyanmarNamibiaNauruNepalNetherlandsNew CaledoniaNew ZealandNicaraguaNigerNigeriaNorth AmericaNorthern Mariana IslandsNorwayOECD membersOmanOther small statesPacific island small statesPakistanPalauPanamaPapua New GuineaParaguayPeruPhilippinesPolandPortugalPost-demographic dividendPre-demographic dividendPuerto RicoQatarRomaniaRussian FederationRwandaSamoaSao Tome and PrincipeSaudi ArabiaSenegalSerbiaSeychellesSierra LeoneSingaporeSlovak RepublicSloveniaSmall statesSolomon IslandsSomaliaSouth AfricaSouth AsiaSouth Asia (IDA & IBRD)SpainSri LankaSt. Kitts and NevisSt. LuciaSt. Vincent and the GrenadinesSub-Saharan Africa Sub-Saharan Africa (excluding high income)Sub-Saharan Africa (IDA & IBRD countries)SudanSurinameSwazilandSwedenSwitzerlandSyrian Arab RepublicTajikistanTanzaniaThailandTimor-LesteTogoTongaTrinidad and TobagoTunisiaTurkeyTurkmenistanTurks and Caicos IslandsTuvaluUgandaUkraineUnited Arab EmiratesUnited KingdomUnited StatesUpper middle incomeUruguayUzbekistanVanuatuVenezuela, RBVietnamVirgin Islands (U.S.)WorldYemen, Rep.ZambiaZimbabwe Timeline:
This timeline shows a graph from 1971 to 2009 of Afghanistan. No data until 1970. Number of actual observations by date: 39.
Source name:
World Development Indicators
Source organization:
World Bank staff estimates from original source: European Commission, Joint Research Centre (JRC)/Netherlands Environmental Assessment Agency (PBL). Emission Database for Global Atmospheric Research (EDGAR): http://edgar.jrc.ec.europa.eu/.
Categories, topics:
Agriculture & Rural Development, Environment
Last updated:
apr 23, 2017
Indicators value changes by year
Minimum:
59.266
jan 1, 1987
Maximum:
77.073
jan 1, 1971
At the date of observation
Value
Absolute change
Change from previous value
jan 1, 1971
77.073
+77.073
0.0%
jan 1, 1972
76.649
-0.424
-0.55%
jan 1, 1973
72.758
-3.892
-5.08%
jan 1, 1974
74.017
+1.259
1.73%
jan 1, 1975
73.869
-0.147
-0.2%
jan 1, 1976
74.796
+0.927
1.25%
jan 1, 1977
75.497
+0.7
0.94%
jan 1, 1978
74.421
-1.076
-1.43%
jan 1, 1979
74.367
-0.054
-0.07%
jan 1, 1980
74.111
-0.256
-0.34%
jan 1, 1981
71.801
-2.31
-3.12%
jan 1, 1982
71.749
-0.052
-0.07%
jan 1, 1983
71.416
-0.333
-0.46%
jan 1, 1984
69.562
-1.854
-2.6%
jan 1, 1985
65.942
-3.621
-5.2%
jan 1, 1986
63.819
-2.123
-3.22%
jan 1, 1987
59.266
-4.553
-7.13%
jan 1, 1988
63.601
+4.335
7.31%
jan 1, 1989
63.813
+0.211
0.33%
jan 1, 1990
66.475
+2.662
4.17%
jan 1, 1991
65.923
-0.552
-0.83%
jan 1, 1992
65.041
-0.882
-1.34%
jan 1, 1993
68.356
+3.316
5.1%
jan 1, 1994
68.294
-0.063
-0.09%
jan 1, 1995
68.852
+0.559
0.82%
jan 1, 1996
69.532
+0.679
0.99%
jan 1, 1997
71.753
+2.221
3.19%
jan 1, 1998
73.126
+1.373
1.91%
jan 1, 1999
73.881
+0.756
1.03%
jan 1, 2000
74.666
+0.785
1.06%
jan 1, 2001
71.21
-3.456
-4.63%
jan 1, 2002
67.473
-3.737
-5.25%
jan 1, 2003
69.323
+1.851
2.74%
jan 1, 2004
68.613
-0.71
-1.02%
jan 1, 2005
67.209
-1.404
-2.05%
jan 1, 2006
66.089
-1.12
-1.67%
jan 1, 2007
64.896
-1.193
-1.81%
jan 1, 2008
63.759
-1.137
-1.75%
jan 1, 2009
62.651
-1.107
-1.74%
Ranking of countries by current statistics by years


Comments: