29
/
en
AIzaSyAYiBZKx7MnpbEhh9jyipgxe19OcubqV5w
April 1, 2024
154212
India
IND
true
2
1
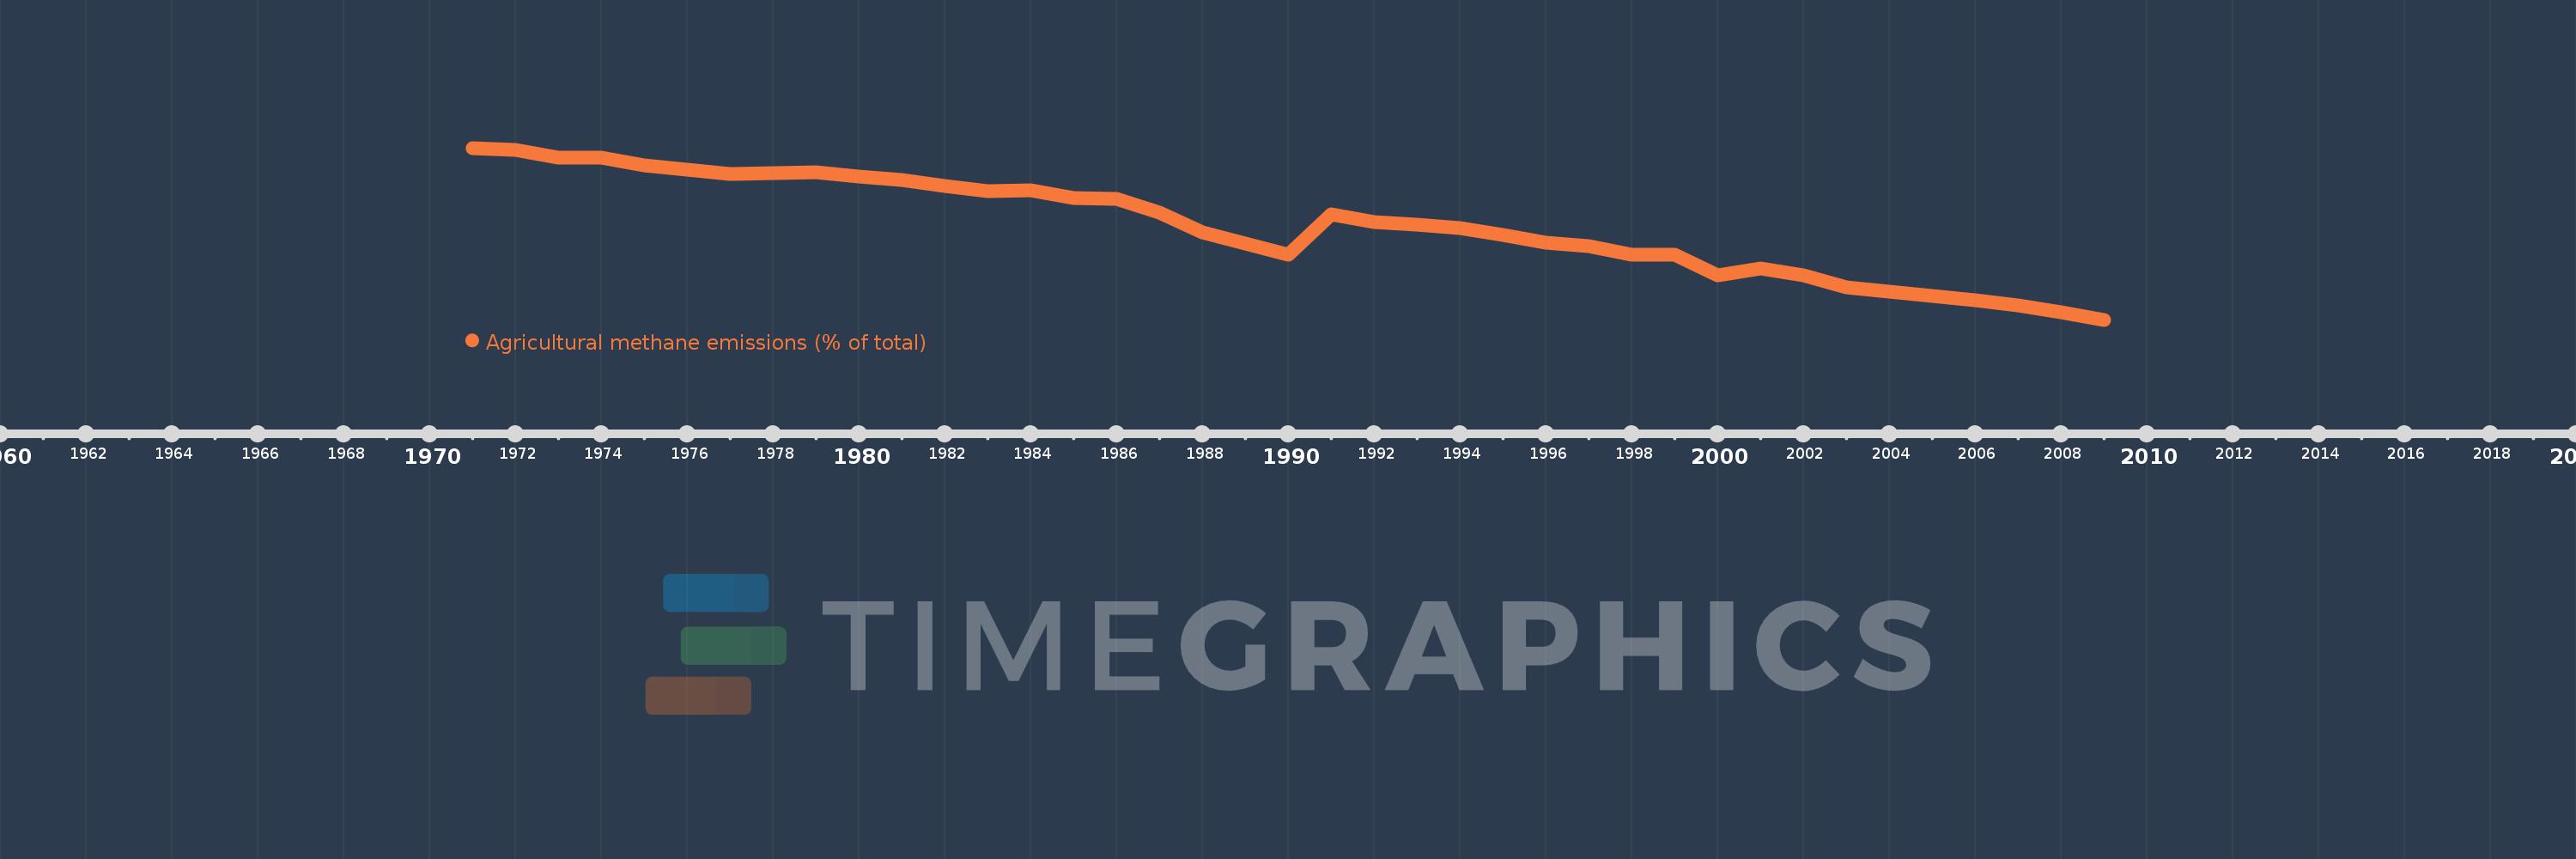
Agricultural methane emissions (% of total)
2009,2008,2007,2006,2005,2004,2003,2002,2001,2000,1999,1998,1997,1996,1995,1994,1993,1992,1991,1990,1989,1988,1987,1986,1985,1984,1983,1982,1981,1980,1979,1978,1977,1976,1975,1974,1973,1972,1971
This statistics in other country:
AfghanistanAlbaniaAlgeriaAmerican SamoaAngolaAntigua and BarbudaArab WorldArgentinaArmeniaArubaAustraliaAustriaAzerbaijanBahamas, TheBahrainBangladeshBarbadosBelarusBelgiumBelizeBeninBermudaBhutanBoliviaBosnia and HerzegovinaBotswanaBrazilBritish Virgin IslandsBrunei DarussalamBulgariaBurkina FasoBurundiCabo VerdeCambodiaCameroonCanadaCaribbean small statesCayman IslandsCentral African RepublicCentral Europe and the BalticsChadChileChinaColombiaComorosCongo, Dem. Rep.Congo, Rep.Costa RicaCote d'IvoireCroatiaCubaCyprusCzech RepublicDenmarkDjiboutiDominicaDominican RepublicEarly-demographic dividendEast Asia & PacificEast Asia & Pacific (excluding high income)East Asia & Pacific (IDA & IBRD countries)EcuadorEgypt, Arab Rep.El SalvadorEquatorial GuineaEritreaEstoniaEthiopiaEuro areaEurope & Central AsiaEurope & Central Asia (excluding high income)Europe & Central Asia (IDA & IBRD countries)European UnionFaroe IslandsFijiFinlandFragile and conflict affected situationsFranceFrench PolynesiaGabonGambia, TheGeorgiaGermanyGhanaGibraltarGreeceGreenlandGrenadaGuamGuatemalaGuineaGuinea-BissauGuyanaHaitiHeavily indebted poor countries (HIPC)High incomeHondurasHong Kong SAR, ChinaHungaryIBRD onlyIcelandIDA & IBRD totalIDA blendIDA onlyIDA totalIndiaIndonesiaIran, Islamic Rep.IraqIrelandIsraelItalyJamaicaJapanJordanKazakhstanKenyaKiribatiKorea, Dem. People’s Rep.Korea, Rep.KuwaitKyrgyz RepublicLao PDRLate-demographic dividendLatin America & Caribbean Latin America & Caribbean (excluding high income)Latin America & the Caribbean (IDA & IBRD countries)LatviaLeast developed countries: UN classificationLebanonLesothoLiberiaLibyaLithuaniaLow & middle incomeLow incomeLower middle incomeLuxembourgMacao SAR, ChinaMacedonia, FYRMadagascarMalawiMalaysiaMaldivesMaliMaltaMarshall IslandsMauritaniaMauritiusMexicoMicronesia, Fed. Sts.Middle East & North AfricaMiddle East & North Africa (excluding high income)Middle East & North Africa (IDA & IBRD countries)Middle incomeMoldovaMongoliaMoroccoMozambiqueMyanmarNamibiaNauruNepalNetherlandsNew CaledoniaNew ZealandNicaraguaNigerNigeriaNorth AmericaNorthern Mariana IslandsNorwayOECD membersOmanOther small statesPacific island small statesPakistanPalauPanamaPapua New GuineaParaguayPeruPhilippinesPolandPortugalPost-demographic dividendPre-demographic dividendPuerto RicoQatarRomaniaRussian FederationRwandaSamoaSao Tome and PrincipeSaudi ArabiaSenegalSerbiaSeychellesSierra LeoneSingaporeSlovak RepublicSloveniaSmall statesSolomon IslandsSomaliaSouth AfricaSouth AsiaSouth Asia (IDA & IBRD)SpainSri LankaSt. Kitts and NevisSt. LuciaSt. Vincent and the GrenadinesSub-Saharan Africa Sub-Saharan Africa (excluding high income)Sub-Saharan Africa (IDA & IBRD countries)SudanSurinameSwazilandSwedenSwitzerlandSyrian Arab RepublicTajikistanTanzaniaThailandTimor-LesteTogoTongaTrinidad and TobagoTunisiaTurkeyTurkmenistanTurks and Caicos IslandsTuvaluUgandaUkraineUnited Arab EmiratesUnited KingdomUnited StatesUpper middle incomeUruguayUzbekistanVanuatuVenezuela, RBVietnamVirgin Islands (U.S.)WorldYemen, Rep.ZambiaZimbabwe Timeline:
This timeline shows a graph from 1971 to 2009 of India. No data until 1970. Number of actual observations by date: 39.
Source name:
World Development Indicators
Source organization:
World Bank staff estimates from original source: European Commission, Joint Research Centre (JRC)/Netherlands Environmental Assessment Agency (PBL). Emission Database for Global Atmospheric Research (EDGAR): http://edgar.jrc.ec.europa.eu/.
Categories, topics:
Agriculture & Rural Development, Environment
Last updated:
apr 23, 2017
Indicators value changes by year
Minimum:
62.673
jan 1, 2009
Maximum:
76.938
jan 1, 1971
At the date of observation
Value
Absolute change
Change from previous value
jan 1, 1971
76.938
+76.938
0.0%
jan 1, 1972
76.751
-0.186
-0.24%
jan 1, 1973
76.165
-0.587
-0.76%
jan 1, 1974
76.129
-0.036
-0.05%
jan 1, 1975
75.522
-0.606
-0.8%
jan 1, 1976
75.102
-0.421
-0.56%
jan 1, 1977
74.742
-0.36
-0.48%
jan 1, 1978
74.848
+0.106
0.14%
jan 1, 1979
74.889
+0.041
0.06%
jan 1, 1980
74.57
-0.32
-0.43%
jan 1, 1981
74.271
-0.298
-0.4%
jan 1, 1982
73.803
-0.468
-0.63%
jan 1, 1983
73.35
-0.454
-0.61%
jan 1, 1984
73.4
+0.05
0.07%
jan 1, 1985
72.8
-0.6
-0.82%
jan 1, 1986
72.685
-0.114
-0.16%
jan 1, 1987
71.554
-1.131
-1.56%
jan 1, 1988
69.936
-1.618
-2.26%
jan 1, 1989
68.997
-0.939
-1.34%
jan 1, 1990
68.098
-0.899
-1.3%
jan 1, 1991
71.44
+3.342
4.91%
jan 1, 1992
70.81
-0.63
-0.88%
jan 1, 1993
70.603
-0.207
-0.29%
jan 1, 1994
70.249
-0.354
-0.5%
jan 1, 1995
69.738
-0.511
-0.73%
jan 1, 1996
69.084
-0.654
-0.94%
jan 1, 1997
68.779
-0.305
-0.44%
jan 1, 1998
68.079
-0.7
-1.02%
jan 1, 1999
68.091
+0.012
0.02%
jan 1, 2000
66.363
-1.728
-2.54%
jan 1, 2001
66.94
+0.577
0.87%
jan 1, 2002
66.353
-0.587
-0.88%
jan 1, 2003
65.379
-0.974
-1.47%
jan 1, 2004
64.976
-0.403
-0.62%
jan 1, 2005
64.64
-0.336
-0.52%
jan 1, 2006
64.305
-0.335
-0.52%
jan 1, 2007
63.884
-0.421
-0.66%
jan 1, 2008
63.319
-0.565
-0.88%
jan 1, 2009
62.673
-0.646
-1.02%
Ranking of countries by current statistics by years


Comments: