29
/
en
AIzaSyAYiBZKx7MnpbEhh9jyipgxe19OcubqV5w
April 1, 2024
95769
Burundi
BDI
true
2
1
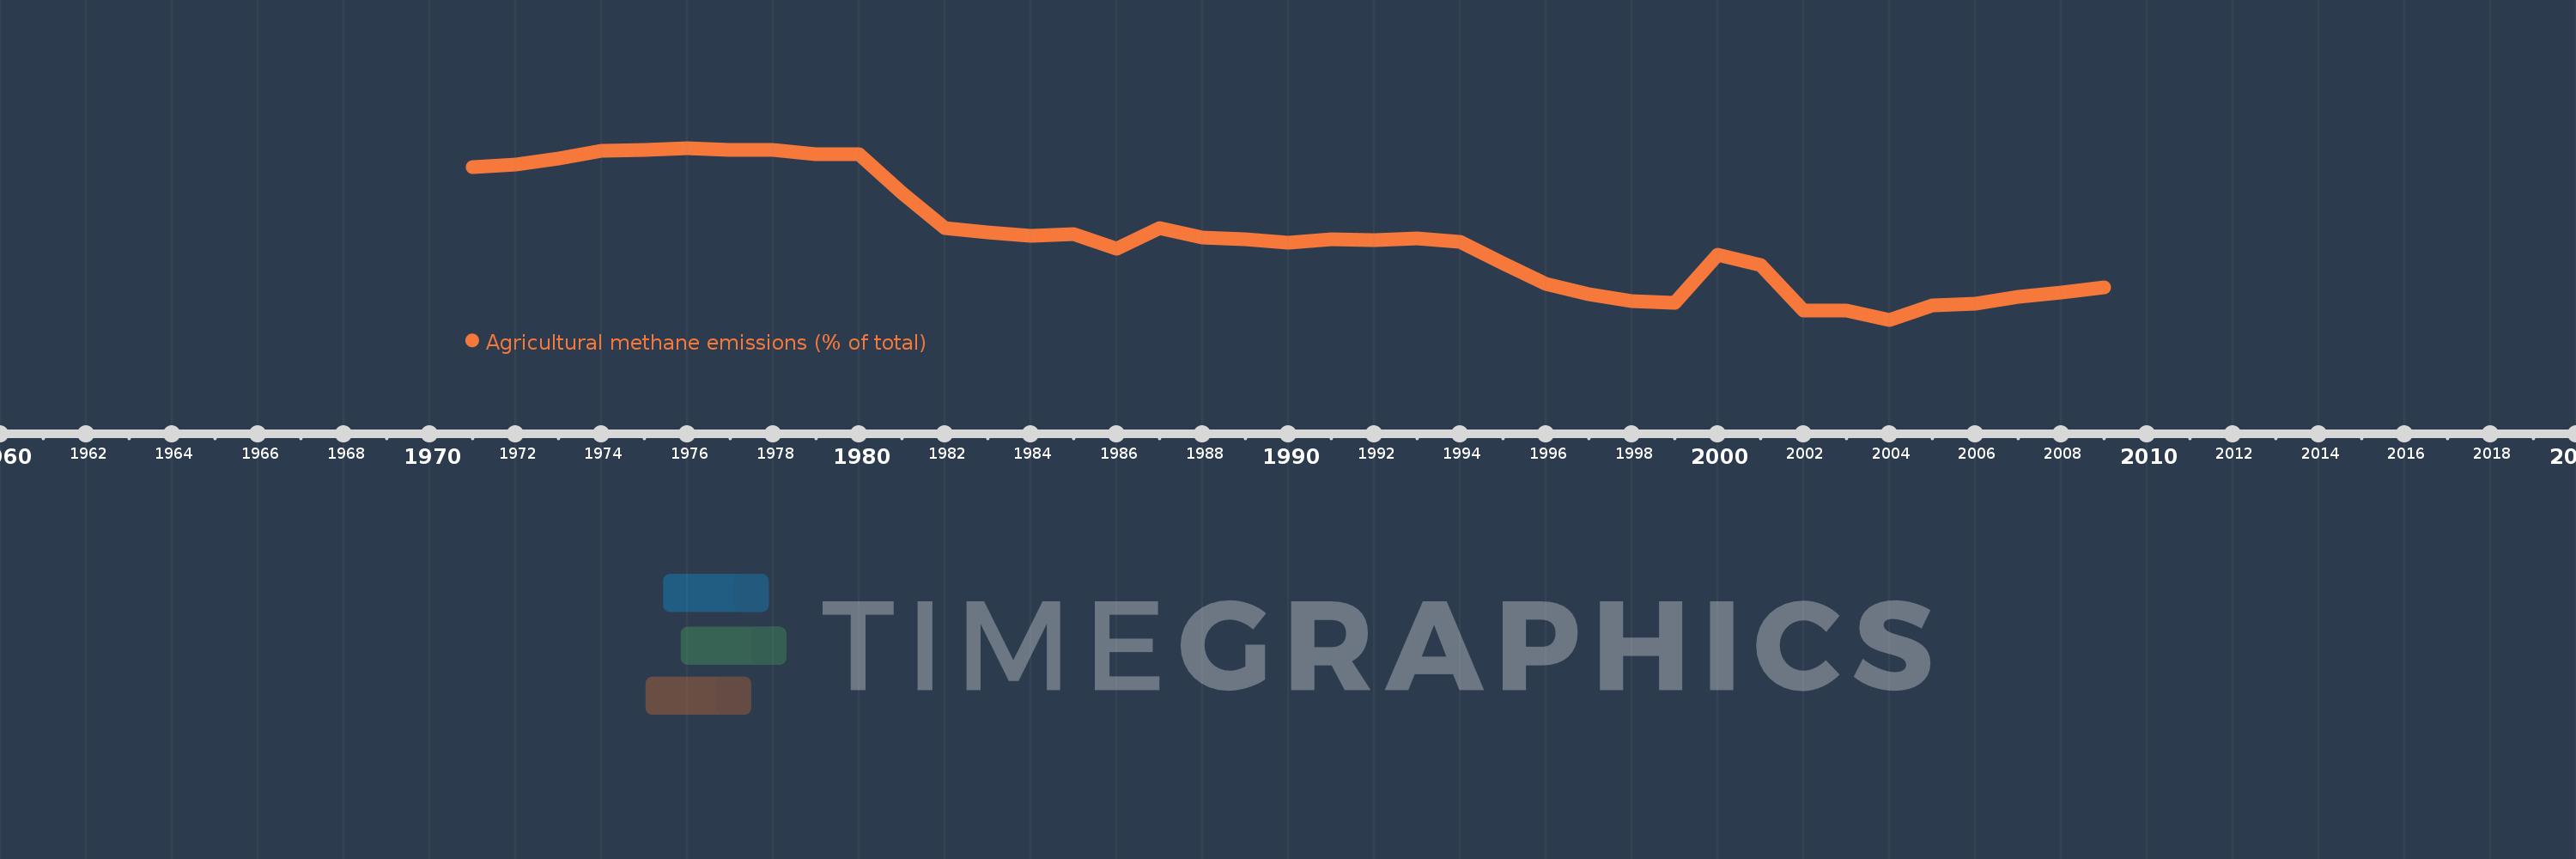
Agricultural methane emissions (% of total)
2009,2008,2007,2006,2005,2004,2003,2002,2001,2000,1999,1998,1997,1996,1995,1994,1993,1992,1991,1990,1989,1988,1987,1986,1985,1984,1983,1982,1981,1980,1979,1978,1977,1976,1975,1974,1973,1972,1971
This statistics in other country:
AfghanistanAlbaniaAlgeriaAmerican SamoaAngolaAntigua and BarbudaArab WorldArgentinaArmeniaArubaAustraliaAustriaAzerbaijanBahamas, TheBahrainBangladeshBarbadosBelarusBelgiumBelizeBeninBermudaBhutanBoliviaBosnia and HerzegovinaBotswanaBrazilBritish Virgin IslandsBrunei DarussalamBulgariaBurkina FasoBurundiCabo VerdeCambodiaCameroonCanadaCaribbean small statesCayman IslandsCentral African RepublicCentral Europe and the BalticsChadChileChinaColombiaComorosCongo, Dem. Rep.Congo, Rep.Costa RicaCote d'IvoireCroatiaCubaCyprusCzech RepublicDenmarkDjiboutiDominicaDominican RepublicEarly-demographic dividendEast Asia & PacificEast Asia & Pacific (excluding high income)East Asia & Pacific (IDA & IBRD countries)EcuadorEgypt, Arab Rep.El SalvadorEquatorial GuineaEritreaEstoniaEthiopiaEuro areaEurope & Central AsiaEurope & Central Asia (excluding high income)Europe & Central Asia (IDA & IBRD countries)European UnionFaroe IslandsFijiFinlandFragile and conflict affected situationsFranceFrench PolynesiaGabonGambia, TheGeorgiaGermanyGhanaGibraltarGreeceGreenlandGrenadaGuamGuatemalaGuineaGuinea-BissauGuyanaHaitiHeavily indebted poor countries (HIPC)High incomeHondurasHong Kong SAR, ChinaHungaryIBRD onlyIcelandIDA & IBRD totalIDA blendIDA onlyIDA totalIndiaIndonesiaIran, Islamic Rep.IraqIrelandIsraelItalyJamaicaJapanJordanKazakhstanKenyaKiribatiKorea, Dem. People’s Rep.Korea, Rep.KuwaitKyrgyz RepublicLao PDRLate-demographic dividendLatin America & Caribbean Latin America & Caribbean (excluding high income)Latin America & the Caribbean (IDA & IBRD countries)LatviaLeast developed countries: UN classificationLebanonLesothoLiberiaLibyaLithuaniaLow & middle incomeLow incomeLower middle incomeLuxembourgMacao SAR, ChinaMacedonia, FYRMadagascarMalawiMalaysiaMaldivesMaliMaltaMarshall IslandsMauritaniaMauritiusMexicoMicronesia, Fed. Sts.Middle East & North AfricaMiddle East & North Africa (excluding high income)Middle East & North Africa (IDA & IBRD countries)Middle incomeMoldovaMongoliaMoroccoMozambiqueMyanmarNamibiaNauruNepalNetherlandsNew CaledoniaNew ZealandNicaraguaNigerNigeriaNorth AmericaNorthern Mariana IslandsNorwayOECD membersOmanOther small statesPacific island small statesPakistanPalauPanamaPapua New GuineaParaguayPeruPhilippinesPolandPortugalPost-demographic dividendPre-demographic dividendPuerto RicoQatarRomaniaRussian FederationRwandaSamoaSao Tome and PrincipeSaudi ArabiaSenegalSerbiaSeychellesSierra LeoneSingaporeSlovak RepublicSloveniaSmall statesSolomon IslandsSomaliaSouth AfricaSouth AsiaSouth Asia (IDA & IBRD)SpainSri LankaSt. Kitts and NevisSt. LuciaSt. Vincent and the GrenadinesSub-Saharan Africa Sub-Saharan Africa (excluding high income)Sub-Saharan Africa (IDA & IBRD countries)SudanSurinameSwazilandSwedenSwitzerlandSyrian Arab RepublicTajikistanTanzaniaThailandTimor-LesteTogoTongaTrinidad and TobagoTunisiaTurkeyTurkmenistanTurks and Caicos IslandsTuvaluUgandaUkraineUnited Arab EmiratesUnited KingdomUnited StatesUpper middle incomeUruguayUzbekistanVanuatuVenezuela, RBVietnamVirgin Islands (U.S.)WorldYemen, Rep.ZambiaZimbabwe Timeline:
This timeline shows a graph from 1971 to 2009 of Burundi. No data until 1970. Number of actual observations by date: 39.
Source name:
World Development Indicators
Source organization:
World Bank staff estimates from original source: European Commission, Joint Research Centre (JRC)/Netherlands Environmental Assessment Agency (PBL). Emission Database for Global Atmospheric Research (EDGAR): http://edgar.jrc.ec.europa.eu/.
Categories, topics:
Agriculture & Rural Development, Environment
Last updated:
apr 23, 2017
Indicators value changes by year
Maximum:
44.038
jan 1, 1976
At the date of observation
Value
Absolute change
Change from previous value
jan 1, 1971
41.143
+41.143
0.0%
jan 1, 1972
41.474
+0.331
0.8%
jan 1, 1973
42.445
+0.971
2.34%
jan 1, 1974
43.617
+1.172
2.76%
jan 1, 1975
43.675
+0.058
0.13%
jan 1, 1976
44.038
+0.363
0.83%
jan 1, 1977
43.716
-0.322
-0.73%
jan 1, 1978
43.73
+0.014
0.03%
jan 1, 1979
43.096
-0.634
-1.45%
jan 1, 1980
43.084
-0.012
-0.03%
jan 1, 1981
37.122
-5.961
-13.84%
jan 1, 1982
31.682
-5.441
-14.66%
jan 1, 1983
31.002
-0.679
-2.14%
jan 1, 1984
30.578
-0.425
-1.37%
jan 1, 1985
30.791
+0.214
0.7%
jan 1, 1986
28.513
-2.278
-7.4%
jan 1, 1987
31.755
+3.242
11.37%
jan 1, 1988
30.316
-1.439
-4.53%
jan 1, 1989
30.033
-0.283
-0.93%
jan 1, 1990
29.463
-0.569
-1.9%
jan 1, 1991
29.953
+0.49
1.66%
jan 1, 1992
29.873
-0.08
-0.27%
jan 1, 1993
30.112
+0.239
0.8%
jan 1, 1994
29.584
-0.529
-1.76%
jan 1, 1995
26.244
-3.339
-11.29%
jan 1, 1996
23.165
-3.079
-11.73%
jan 1, 1997
21.576
-1.589
-6.86%
jan 1, 1998
20.417
-1.16
-5.37%
jan 1, 1999
20.204
-0.212
-1.04%
jan 1, 2000
27.652
+7.447
36.86%
jan 1, 2001
26.017
-1.634
-5.91%
jan 1, 2002
18.992
-7.026
-27.0%
jan 1, 2003
18.99
-0.002
-0.01%
jan 1, 2004
17.6
-1.389
-7.32%
jan 1, 2005
19.777
+2.176
12.37%
jan 1, 2006
20.104
+0.327
1.65%
jan 1, 2007
21.181
+1.077
5.36%
jan 1, 2008
21.819
+0.638
3.01%
jan 1, 2009
22.595
+0.776
3.55%
Ranking of countries by current statistics by years


Comments: