29
/
en
AIzaSyAYiBZKx7MnpbEhh9jyipgxe19OcubqV5w
April 1, 2024
23887
Arab World
ARB
false
2
1
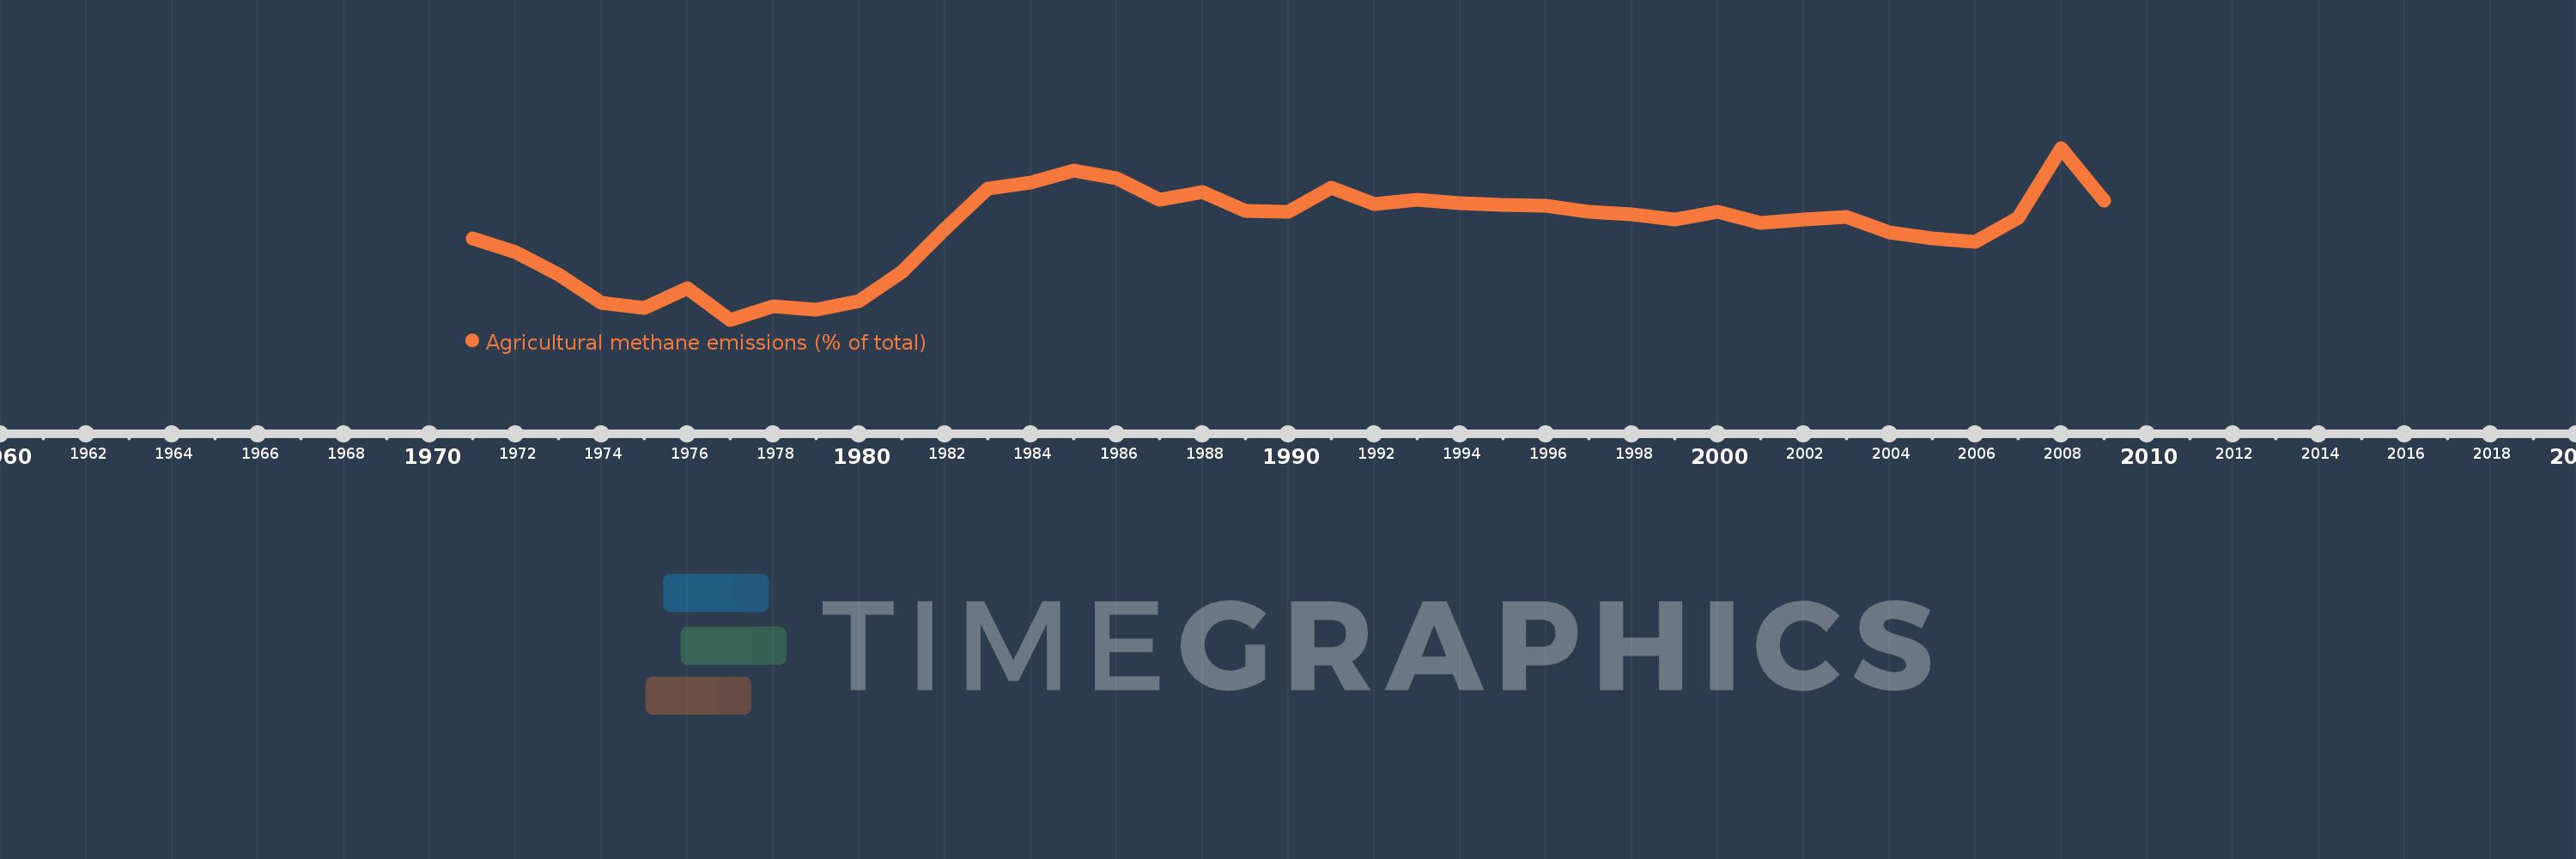
Agricultural methane emissions (% of total)
2009,2008,2007,2006,2005,2004,2003,2002,2001,2000,1999,1998,1997,1996,1995,1994,1993,1992,1991,1990,1989,1988,1987,1986,1985,1984,1983,1982,1981,1980,1979,1978,1977,1976,1975,1974,1973,1972,1971
This statistics in other country:
AfghanistanAlbaniaAlgeriaAmerican SamoaAngolaAntigua and BarbudaArab WorldArgentinaArmeniaArubaAustraliaAustriaAzerbaijanBahamas, TheBahrainBangladeshBarbadosBelarusBelgiumBelizeBeninBermudaBhutanBoliviaBosnia and HerzegovinaBotswanaBrazilBritish Virgin IslandsBrunei DarussalamBulgariaBurkina FasoBurundiCabo VerdeCambodiaCameroonCanadaCaribbean small statesCayman IslandsCentral African RepublicCentral Europe and the BalticsChadChileChinaColombiaComorosCongo, Dem. Rep.Congo, Rep.Costa RicaCote d'IvoireCroatiaCubaCyprusCzech RepublicDenmarkDjiboutiDominicaDominican RepublicEarly-demographic dividendEast Asia & PacificEast Asia & Pacific (excluding high income)East Asia & Pacific (IDA & IBRD countries)EcuadorEgypt, Arab Rep.El SalvadorEquatorial GuineaEritreaEstoniaEthiopiaEuro areaEurope & Central AsiaEurope & Central Asia (excluding high income)Europe & Central Asia (IDA & IBRD countries)European UnionFaroe IslandsFijiFinlandFragile and conflict affected situationsFranceFrench PolynesiaGabonGambia, TheGeorgiaGermanyGhanaGibraltarGreeceGreenlandGrenadaGuamGuatemalaGuineaGuinea-BissauGuyanaHaitiHeavily indebted poor countries (HIPC)High incomeHondurasHong Kong SAR, ChinaHungaryIBRD onlyIcelandIDA & IBRD totalIDA blendIDA onlyIDA totalIndiaIndonesiaIran, Islamic Rep.IraqIrelandIsraelItalyJamaicaJapanJordanKazakhstanKenyaKiribatiKorea, Dem. People’s Rep.Korea, Rep.KuwaitKyrgyz RepublicLao PDRLate-demographic dividendLatin America & Caribbean Latin America & Caribbean (excluding high income)Latin America & the Caribbean (IDA & IBRD countries)LatviaLeast developed countries: UN classificationLebanonLesothoLiberiaLibyaLithuaniaLow & middle incomeLow incomeLower middle incomeLuxembourgMacao SAR, ChinaMacedonia, FYRMadagascarMalawiMalaysiaMaldivesMaliMaltaMarshall IslandsMauritaniaMauritiusMexicoMicronesia, Fed. Sts.Middle East & North AfricaMiddle East & North Africa (excluding high income)Middle East & North Africa (IDA & IBRD countries)Middle incomeMoldovaMongoliaMoroccoMozambiqueMyanmarNamibiaNauruNepalNetherlandsNew CaledoniaNew ZealandNicaraguaNigerNigeriaNorth AmericaNorthern Mariana IslandsNorwayOECD membersOmanOther small statesPacific island small statesPakistanPalauPanamaPapua New GuineaParaguayPeruPhilippinesPolandPortugalPost-demographic dividendPre-demographic dividendPuerto RicoQatarRomaniaRussian FederationRwandaSamoaSao Tome and PrincipeSaudi ArabiaSenegalSerbiaSeychellesSierra LeoneSingaporeSlovak RepublicSloveniaSmall statesSolomon IslandsSomaliaSouth AfricaSouth AsiaSouth Asia (IDA & IBRD)SpainSri LankaSt. Kitts and NevisSt. LuciaSt. Vincent and the GrenadinesSub-Saharan Africa Sub-Saharan Africa (excluding high income)Sub-Saharan Africa (IDA & IBRD countries)SudanSurinameSwazilandSwedenSwitzerlandSyrian Arab RepublicTajikistanTanzaniaThailandTimor-LesteTogoTongaTrinidad and TobagoTunisiaTurkeyTurkmenistanTurks and Caicos IslandsTuvaluUgandaUkraineUnited Arab EmiratesUnited KingdomUnited StatesUpper middle incomeUruguayUzbekistanVanuatuVenezuela, RBVietnamVirgin Islands (U.S.)WorldYemen, Rep.ZambiaZimbabwe Timeline:
This timeline shows a graph from 1971 to 2009 of Arab World. No data until 1970. Number of actual observations by date: 39.
Source name:
World Development Indicators
Source organization:
World Bank staff estimates from original source: European Commission, Joint Research Centre (JRC)/Netherlands Environmental Assessment Agency (PBL). Emission Database for Global Atmospheric Research (EDGAR): http://edgar.jrc.ec.europa.eu/.
Categories, topics:
Agriculture & Rural Development, Environment
Last updated:
apr 23, 2017
Indicators value changes by year
Minimum:
23.869
jan 1, 1977
Maximum:
37.949
jan 1, 2008
At the date of observation
Value
Absolute change
Change from previous value
jan 1, 1971
30.558
+30.558
0.0%
jan 1, 1972
29.426
-1.132
-3.71%
jan 1, 1973
27.593
-1.833
-6.23%
jan 1, 1974
25.287
-2.307
-8.36%
jan 1, 1975
24.829
-0.458
-1.81%
jan 1, 1976
26.453
+1.625
6.54%
jan 1, 1977
23.869
-2.584
-9.77%
jan 1, 1978
24.982
+1.112
4.66%
jan 1, 1979
24.717
-0.265
-1.06%
jan 1, 1980
25.393
+0.676
2.74%
jan 1, 1981
27.817
+2.423
9.54%
jan 1, 1982
31.312
+3.495
12.57%
jan 1, 1983
34.634
+3.323
10.61%
jan 1, 1984
35.13
+0.496
1.43%
jan 1, 1985
36.121
+0.991
2.82%
jan 1, 1986
35.434
-0.687
-1.9%
jan 1, 1987
33.724
-1.71
-4.83%
jan 1, 1988
34.344
+0.621
1.84%
jan 1, 1989
32.755
-1.589
-4.63%
jan 1, 1990
32.7
-0.055
-0.17%
jan 1, 1991
34.709
+2.009
6.14%
jan 1, 1992
33.32
-1.388
-4.0%
jan 1, 1993
33.725
+0.405
1.22%
jan 1, 1994
33.419
-0.307
-0.91%
jan 1, 1995
33.29
-0.129
-0.39%
jan 1, 1996
33.201
-0.088
-0.26%
jan 1, 1997
32.69
-0.512
-1.54%
jan 1, 1998
32.51
-0.18
-0.55%
jan 1, 1999
32.07
-0.44
-1.35%
jan 1, 2000
32.719
+0.648
2.02%
jan 1, 2001
31.818
-0.901
-2.75%
jan 1, 2002
32.089
+0.271
0.85%
jan 1, 2003
32.291
+0.202
0.63%
jan 1, 2004
31.036
-1.255
-3.89%
jan 1, 2005
30.542
-0.494
-1.59%
jan 1, 2006
30.275
-0.267
-0.87%
jan 1, 2007
32.226
+1.951
6.44%
jan 1, 2008
37.949
+5.722
17.76%
jan 1, 2009
33.635
-4.314
-11.37%
Ranking of countries by current statistics by years


Comments: