29
/
en
AIzaSyAYiBZKx7MnpbEhh9jyipgxe19OcubqV5w
April 1, 2024
211329
Niger
NER
true
2
1
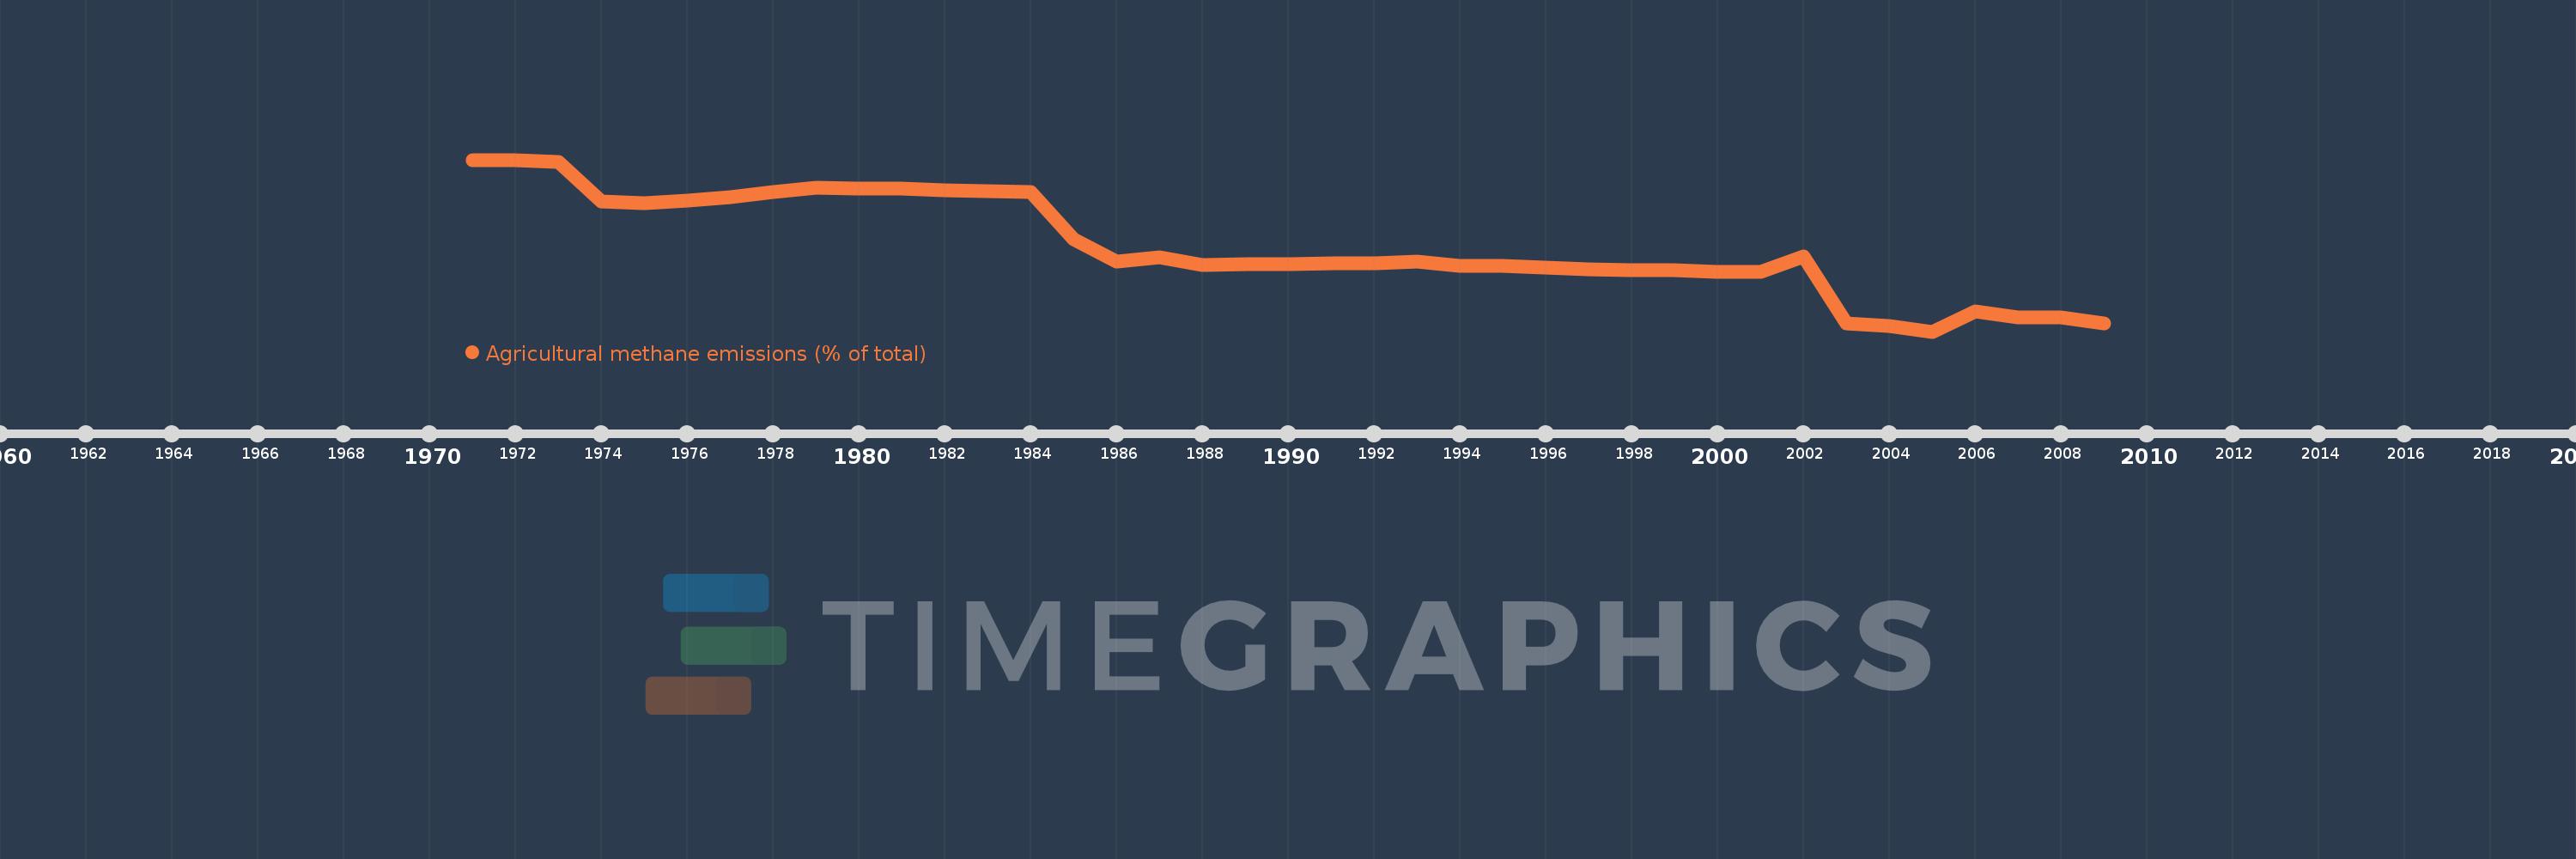
Agricultural methane emissions (% of total)
2009,2008,2007,2006,2005,2004,2003,2002,2001,2000,1999,1998,1997,1996,1995,1994,1993,1992,1991,1990,1989,1988,1987,1986,1985,1984,1983,1982,1981,1980,1979,1978,1977,1976,1975,1974,1973,1972,1971
This statistics in other country:
AfghanistanAlbaniaAlgeriaAmerican SamoaAngolaAntigua and BarbudaArab WorldArgentinaArmeniaArubaAustraliaAustriaAzerbaijanBahamas, TheBahrainBangladeshBarbadosBelarusBelgiumBelizeBeninBermudaBhutanBoliviaBosnia and HerzegovinaBotswanaBrazilBritish Virgin IslandsBrunei DarussalamBulgariaBurkina FasoBurundiCabo VerdeCambodiaCameroonCanadaCaribbean small statesCayman IslandsCentral African RepublicCentral Europe and the BalticsChadChileChinaColombiaComorosCongo, Dem. Rep.Congo, Rep.Costa RicaCote d'IvoireCroatiaCubaCyprusCzech RepublicDenmarkDjiboutiDominicaDominican RepublicEarly-demographic dividendEast Asia & PacificEast Asia & Pacific (excluding high income)East Asia & Pacific (IDA & IBRD countries)EcuadorEgypt, Arab Rep.El SalvadorEquatorial GuineaEritreaEstoniaEthiopiaEuro areaEurope & Central AsiaEurope & Central Asia (excluding high income)Europe & Central Asia (IDA & IBRD countries)European UnionFaroe IslandsFijiFinlandFragile and conflict affected situationsFranceFrench PolynesiaGabonGambia, TheGeorgiaGermanyGhanaGibraltarGreeceGreenlandGrenadaGuamGuatemalaGuineaGuinea-BissauGuyanaHaitiHeavily indebted poor countries (HIPC)High incomeHondurasHong Kong SAR, ChinaHungaryIBRD onlyIcelandIDA & IBRD totalIDA blendIDA onlyIDA totalIndiaIndonesiaIran, Islamic Rep.IraqIrelandIsraelItalyJamaicaJapanJordanKazakhstanKenyaKiribatiKorea, Dem. People’s Rep.Korea, Rep.KuwaitKyrgyz RepublicLao PDRLate-demographic dividendLatin America & Caribbean Latin America & Caribbean (excluding high income)Latin America & the Caribbean (IDA & IBRD countries)LatviaLeast developed countries: UN classificationLebanonLesothoLiberiaLibyaLithuaniaLow & middle incomeLow incomeLower middle incomeLuxembourgMacao SAR, ChinaMacedonia, FYRMadagascarMalawiMalaysiaMaldivesMaliMaltaMarshall IslandsMauritaniaMauritiusMexicoMicronesia, Fed. Sts.Middle East & North AfricaMiddle East & North Africa (excluding high income)Middle East & North Africa (IDA & IBRD countries)Middle incomeMoldovaMongoliaMoroccoMozambiqueMyanmarNamibiaNauruNepalNetherlandsNew CaledoniaNew ZealandNicaraguaNigerNigeriaNorth AmericaNorthern Mariana IslandsNorwayOECD membersOmanOther small statesPacific island small statesPakistanPalauPanamaPapua New GuineaParaguayPeruPhilippinesPolandPortugalPost-demographic dividendPre-demographic dividendPuerto RicoQatarRomaniaRussian FederationRwandaSamoaSao Tome and PrincipeSaudi ArabiaSenegalSerbiaSeychellesSierra LeoneSingaporeSlovak RepublicSloveniaSmall statesSolomon IslandsSomaliaSouth AfricaSouth AsiaSouth Asia (IDA & IBRD)SpainSri LankaSt. Kitts and NevisSt. LuciaSt. Vincent and the GrenadinesSub-Saharan Africa Sub-Saharan Africa (excluding high income)Sub-Saharan Africa (IDA & IBRD countries)SudanSurinameSwazilandSwedenSwitzerlandSyrian Arab RepublicTajikistanTanzaniaThailandTimor-LesteTogoTongaTrinidad and TobagoTunisiaTurkeyTurkmenistanTurks and Caicos IslandsTuvaluUgandaUkraineUnited Arab EmiratesUnited KingdomUnited StatesUpper middle incomeUruguayUzbekistanVanuatuVenezuela, RBVietnamVirgin Islands (U.S.)WorldYemen, Rep.ZambiaZimbabwe Timeline:
This timeline shows a graph from 1971 to 2009 of Niger. No data until 1970. Number of actual observations by date: 39.
Source name:
World Development Indicators
Source organization:
World Bank staff estimates from original source: European Commission, Joint Research Centre (JRC)/Netherlands Environmental Assessment Agency (PBL). Emission Database for Global Atmospheric Research (EDGAR): http://edgar.jrc.ec.europa.eu/.
Categories, topics:
Agriculture & Rural Development, Environment
Last updated:
apr 23, 2017
Indicators value changes by year
Minimum:
45.812
jan 1, 2005
Maximum:
83.299
jan 1, 1971
At the date of observation
Value
Absolute change
Change from previous value
jan 1, 1971
83.299
+83.299
0.0%
jan 1, 1972
83.25
-0.049
-0.06%
jan 1, 1973
82.916
-0.334
-0.4%
jan 1, 1974
74.129
-8.787
-10.6%
jan 1, 1975
73.796
-0.333
-0.45%
jan 1, 1976
74.346
+0.55
0.74%
jan 1, 1977
75.132
+0.786
1.06%
jan 1, 1978
76.248
+1.116
1.49%
jan 1, 1979
77.155
+0.907
1.19%
jan 1, 1980
77.094
-0.061
-0.08%
jan 1, 1981
77.023
-0.071
-0.09%
jan 1, 1982
76.582
-0.441
-0.57%
jan 1, 1983
76.537
-0.045
-0.06%
jan 1, 1984
76.262
-0.275
-0.36%
jan 1, 1985
66.047
-10.216
-13.4%
jan 1, 1986
61.0
-5.047
-7.64%
jan 1, 1987
62.06
+1.06
1.74%
jan 1, 1988
60.312
-1.748
-2.82%
jan 1, 1989
60.438
+0.126
0.21%
jan 1, 1990
60.459
+0.02
0.03%
jan 1, 1991
60.8
+0.341
0.56%
jan 1, 1992
60.763
-0.037
-0.06%
jan 1, 1993
61.069
+0.306
0.5%
jan 1, 1994
60.178
-0.891
-1.46%
jan 1, 1995
60.061
-0.117
-0.19%
jan 1, 1996
59.696
-0.366
-0.61%
jan 1, 1997
59.369
-0.327
-0.55%
jan 1, 1998
59.13
-0.239
-0.4%
jan 1, 1999
59.142
+0.012
0.02%
jan 1, 2000
58.818
-0.324
-0.55%
jan 1, 2001
58.765
-0.053
-0.09%
jan 1, 2002
62.236
+3.472
5.91%
jan 1, 2003
47.572
-14.664
-23.56%
jan 1, 2004
46.941
-0.631
-1.33%
jan 1, 2005
45.812
-1.129
-2.41%
jan 1, 2006
50.185
+4.373
9.55%
jan 1, 2007
48.992
-1.193
-2.38%
jan 1, 2008
48.993
+0.001
0.0%
jan 1, 2009
47.577
-1.416
-2.89%
Ranking of countries by current statistics by years


Comments: