29
/
en
AIzaSyAYiBZKx7MnpbEhh9jyipgxe19OcubqV5w
April 1, 2024
196478
Micronesia, Fed. Sts.
FSM
true
2
1
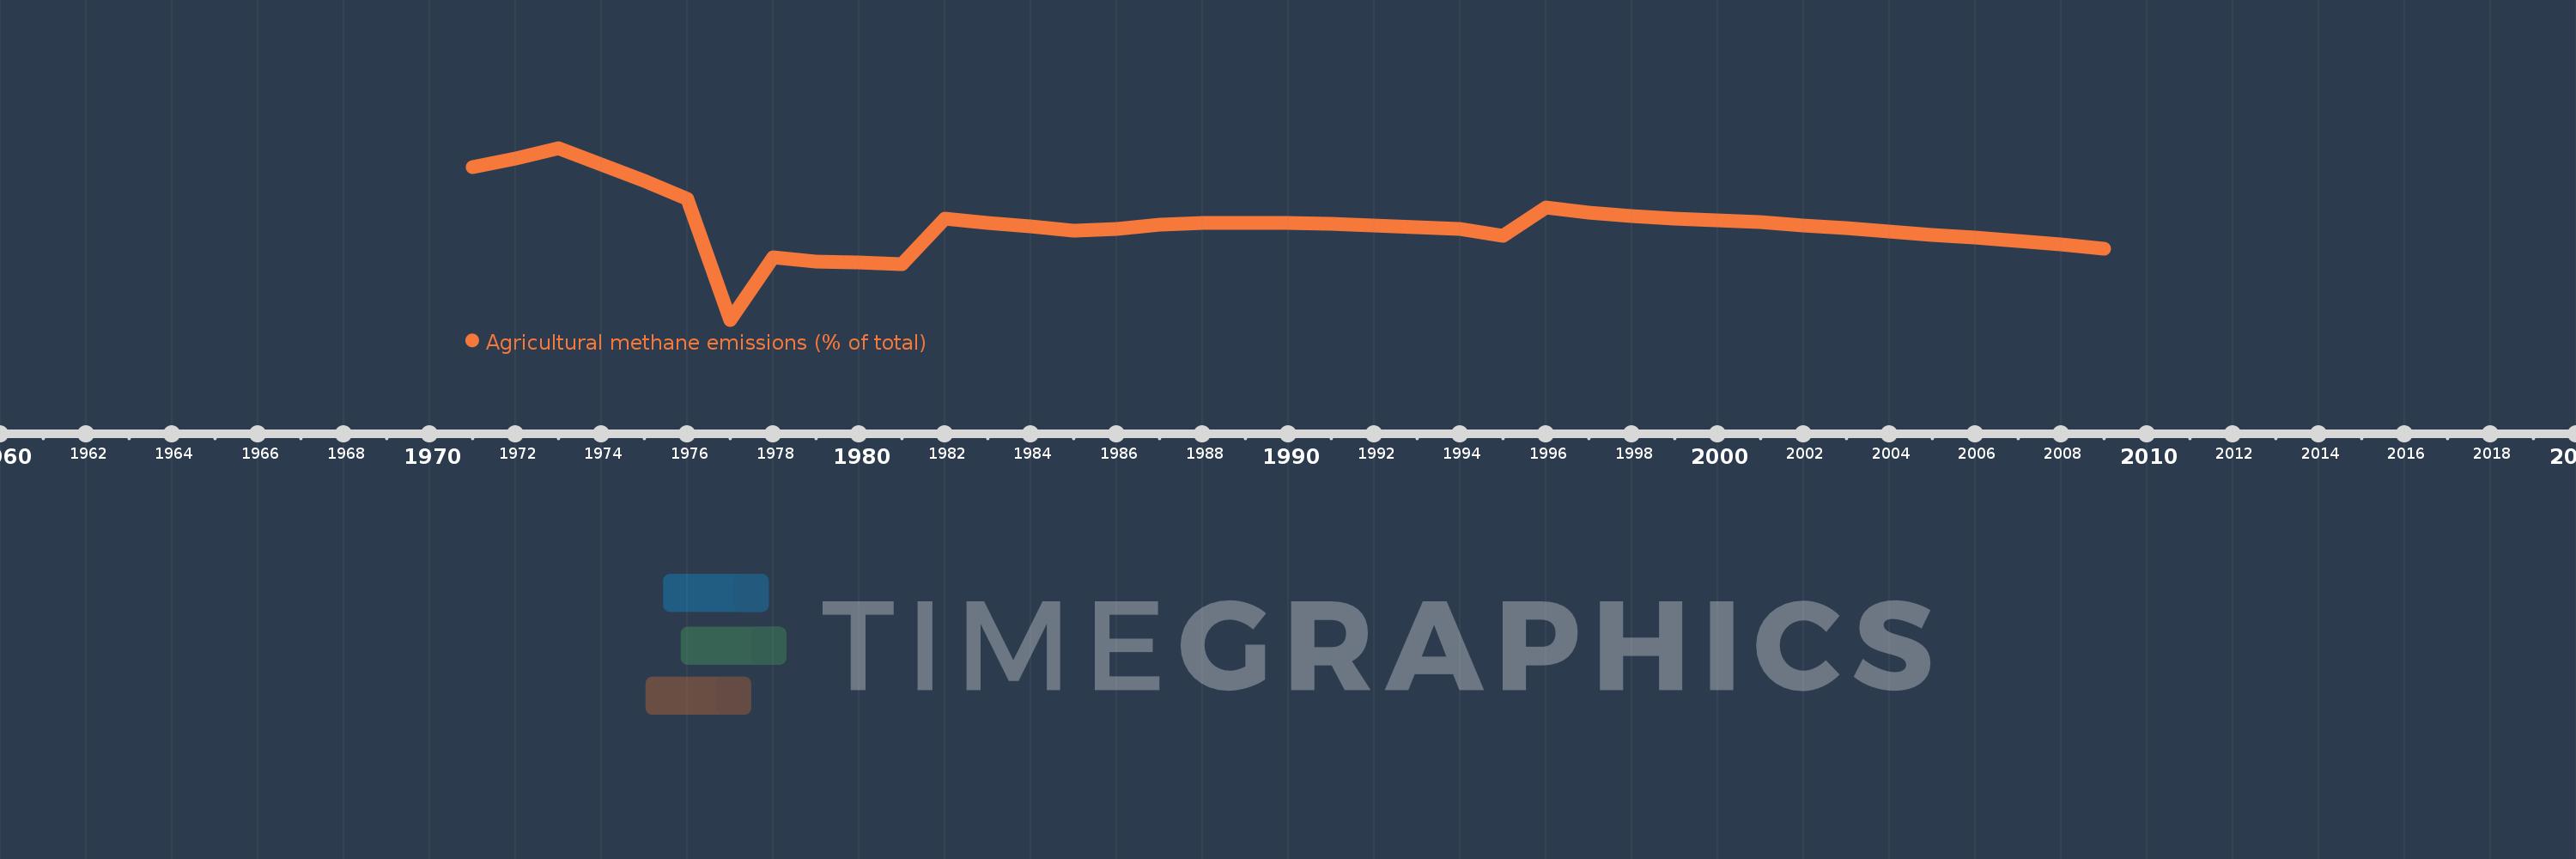
Agricultural methane emissions (% of total)
2009,2008,2007,2006,2005,2004,2003,2002,2001,2000,1999,1998,1997,1996,1995,1994,1993,1992,1991,1990,1989,1988,1987,1986,1985,1984,1983,1982,1981,1980,1979,1978,1977,1976,1975,1974,1973,1972,1971
This statistics in other country:
AfghanistanAlbaniaAlgeriaAmerican SamoaAngolaAntigua and BarbudaArab WorldArgentinaArmeniaArubaAustraliaAustriaAzerbaijanBahamas, TheBahrainBangladeshBarbadosBelarusBelgiumBelizeBeninBermudaBhutanBoliviaBosnia and HerzegovinaBotswanaBrazilBritish Virgin IslandsBrunei DarussalamBulgariaBurkina FasoBurundiCabo VerdeCambodiaCameroonCanadaCaribbean small statesCayman IslandsCentral African RepublicCentral Europe and the BalticsChadChileChinaColombiaComorosCongo, Dem. Rep.Congo, Rep.Costa RicaCote d'IvoireCroatiaCubaCyprusCzech RepublicDenmarkDjiboutiDominicaDominican RepublicEarly-demographic dividendEast Asia & PacificEast Asia & Pacific (excluding high income)East Asia & Pacific (IDA & IBRD countries)EcuadorEgypt, Arab Rep.El SalvadorEquatorial GuineaEritreaEstoniaEthiopiaEuro areaEurope & Central AsiaEurope & Central Asia (excluding high income)Europe & Central Asia (IDA & IBRD countries)European UnionFaroe IslandsFijiFinlandFragile and conflict affected situationsFranceFrench PolynesiaGabonGambia, TheGeorgiaGermanyGhanaGibraltarGreeceGreenlandGrenadaGuamGuatemalaGuineaGuinea-BissauGuyanaHaitiHeavily indebted poor countries (HIPC)High incomeHondurasHong Kong SAR, ChinaHungaryIBRD onlyIcelandIDA & IBRD totalIDA blendIDA onlyIDA totalIndiaIndonesiaIran, Islamic Rep.IraqIrelandIsraelItalyJamaicaJapanJordanKazakhstanKenyaKiribatiKorea, Dem. People’s Rep.Korea, Rep.KuwaitKyrgyz RepublicLao PDRLate-demographic dividendLatin America & Caribbean Latin America & Caribbean (excluding high income)Latin America & the Caribbean (IDA & IBRD countries)LatviaLeast developed countries: UN classificationLebanonLesothoLiberiaLibyaLithuaniaLow & middle incomeLow incomeLower middle incomeLuxembourgMacao SAR, ChinaMacedonia, FYRMadagascarMalawiMalaysiaMaldivesMaliMaltaMarshall IslandsMauritaniaMauritiusMexicoMicronesia, Fed. Sts.Middle East & North AfricaMiddle East & North Africa (excluding high income)Middle East & North Africa (IDA & IBRD countries)Middle incomeMoldovaMongoliaMoroccoMozambiqueMyanmarNamibiaNauruNepalNetherlandsNew CaledoniaNew ZealandNicaraguaNigerNigeriaNorth AmericaNorthern Mariana IslandsNorwayOECD membersOmanOther small statesPacific island small statesPakistanPalauPanamaPapua New GuineaParaguayPeruPhilippinesPolandPortugalPost-demographic dividendPre-demographic dividendPuerto RicoQatarRomaniaRussian FederationRwandaSamoaSao Tome and PrincipeSaudi ArabiaSenegalSerbiaSeychellesSierra LeoneSingaporeSlovak RepublicSloveniaSmall statesSolomon IslandsSomaliaSouth AfricaSouth AsiaSouth Asia (IDA & IBRD)SpainSri LankaSt. Kitts and NevisSt. LuciaSt. Vincent and the GrenadinesSub-Saharan Africa Sub-Saharan Africa (excluding high income)Sub-Saharan Africa (IDA & IBRD countries)SudanSurinameSwazilandSwedenSwitzerlandSyrian Arab RepublicTajikistanTanzaniaThailandTimor-LesteTogoTongaTrinidad and TobagoTunisiaTurkeyTurkmenistanTurks and Caicos IslandsTuvaluUgandaUkraineUnited Arab EmiratesUnited KingdomUnited StatesUpper middle incomeUruguayUzbekistanVanuatuVenezuela, RBVietnamVirgin Islands (U.S.)WorldYemen, Rep.ZambiaZimbabwe Timeline:
This timeline shows a graph from 1971 to 2009 of Micronesia, Fed. Sts.. No data until 1970. Number of actual observations by date: 39.
Source name:
World Development Indicators
Source organization:
World Bank staff estimates from original source: European Commission, Joint Research Centre (JRC)/Netherlands Environmental Assessment Agency (PBL). Emission Database for Global Atmospheric Research (EDGAR): http://edgar.jrc.ec.europa.eu/.
Categories, topics:
Agriculture & Rural Development, Environment
Last updated:
apr 23, 2017
Indicators value changes by year
Minimum:
55.142
jan 1, 1977
Maximum:
76.478
jan 1, 1973
At the date of observation
Value
Absolute change
Change from previous value
jan 1, 1971
74.121
+74.121
0.0%
jan 1, 1972
75.218
+1.097
1.48%
jan 1, 1973
76.478
+1.26
1.67%
jan 1, 1974
74.406
-2.072
-2.71%
jan 1, 1975
72.377
-2.029
-2.73%
jan 1, 1976
70.142
-2.235
-3.09%
jan 1, 1977
55.142
-15.0
-21.39%
jan 1, 1978
62.936
+7.794
14.13%
jan 1, 1979
62.391
-0.545
-0.87%
jan 1, 1980
62.222
-0.169
-0.27%
jan 1, 1981
62.054
-0.168
-0.27%
jan 1, 1982
67.695
+5.641
9.09%
jan 1, 1983
67.217
-0.478
-0.71%
jan 1, 1984
66.733
-0.484
-0.72%
jan 1, 1985
66.213
-0.52
-0.78%
jan 1, 1986
66.383
+0.171
0.26%
jan 1, 1987
66.908
+0.524
0.79%
jan 1, 1988
67.166
+0.258
0.39%
jan 1, 1989
67.178
+0.012
0.02%
jan 1, 1990
67.133
-0.045
-0.07%
jan 1, 1991
67.033
-0.101
-0.15%
jan 1, 1992
66.868
-0.164
-0.24%
jan 1, 1993
66.627
-0.241
-0.36%
jan 1, 1994
66.447
-0.18
-0.27%
jan 1, 1995
65.578
-0.869
-1.31%
jan 1, 1996
69.088
+3.51
5.35%
jan 1, 1997
68.468
-0.619
-0.9%
jan 1, 1998
67.97
-0.498
-0.73%
jan 1, 1999
67.693
-0.278
-0.41%
jan 1, 2000
67.453
-0.239
-0.35%
jan 1, 2001
67.253
-0.2
-0.3%
jan 1, 2002
66.892
-0.361
-0.54%
jan 1, 2003
66.521
-0.371
-0.55%
jan 1, 2004
66.137
-0.385
-0.58%
jan 1, 2005
65.683
-0.453
-0.69%
jan 1, 2006
65.342
-0.341
-0.52%
jan 1, 2007
64.968
-0.374
-0.57%
jan 1, 2008
64.509
-0.459
-0.71%
jan 1, 2009
63.988
-0.521
-0.81%
Ranking of countries by current statistics by years


Comments: