29
/
en
AIzaSyAYiBZKx7MnpbEhh9jyipgxe19OcubqV5w
April 1, 2024
153276
Iceland
ISL
true
2
1
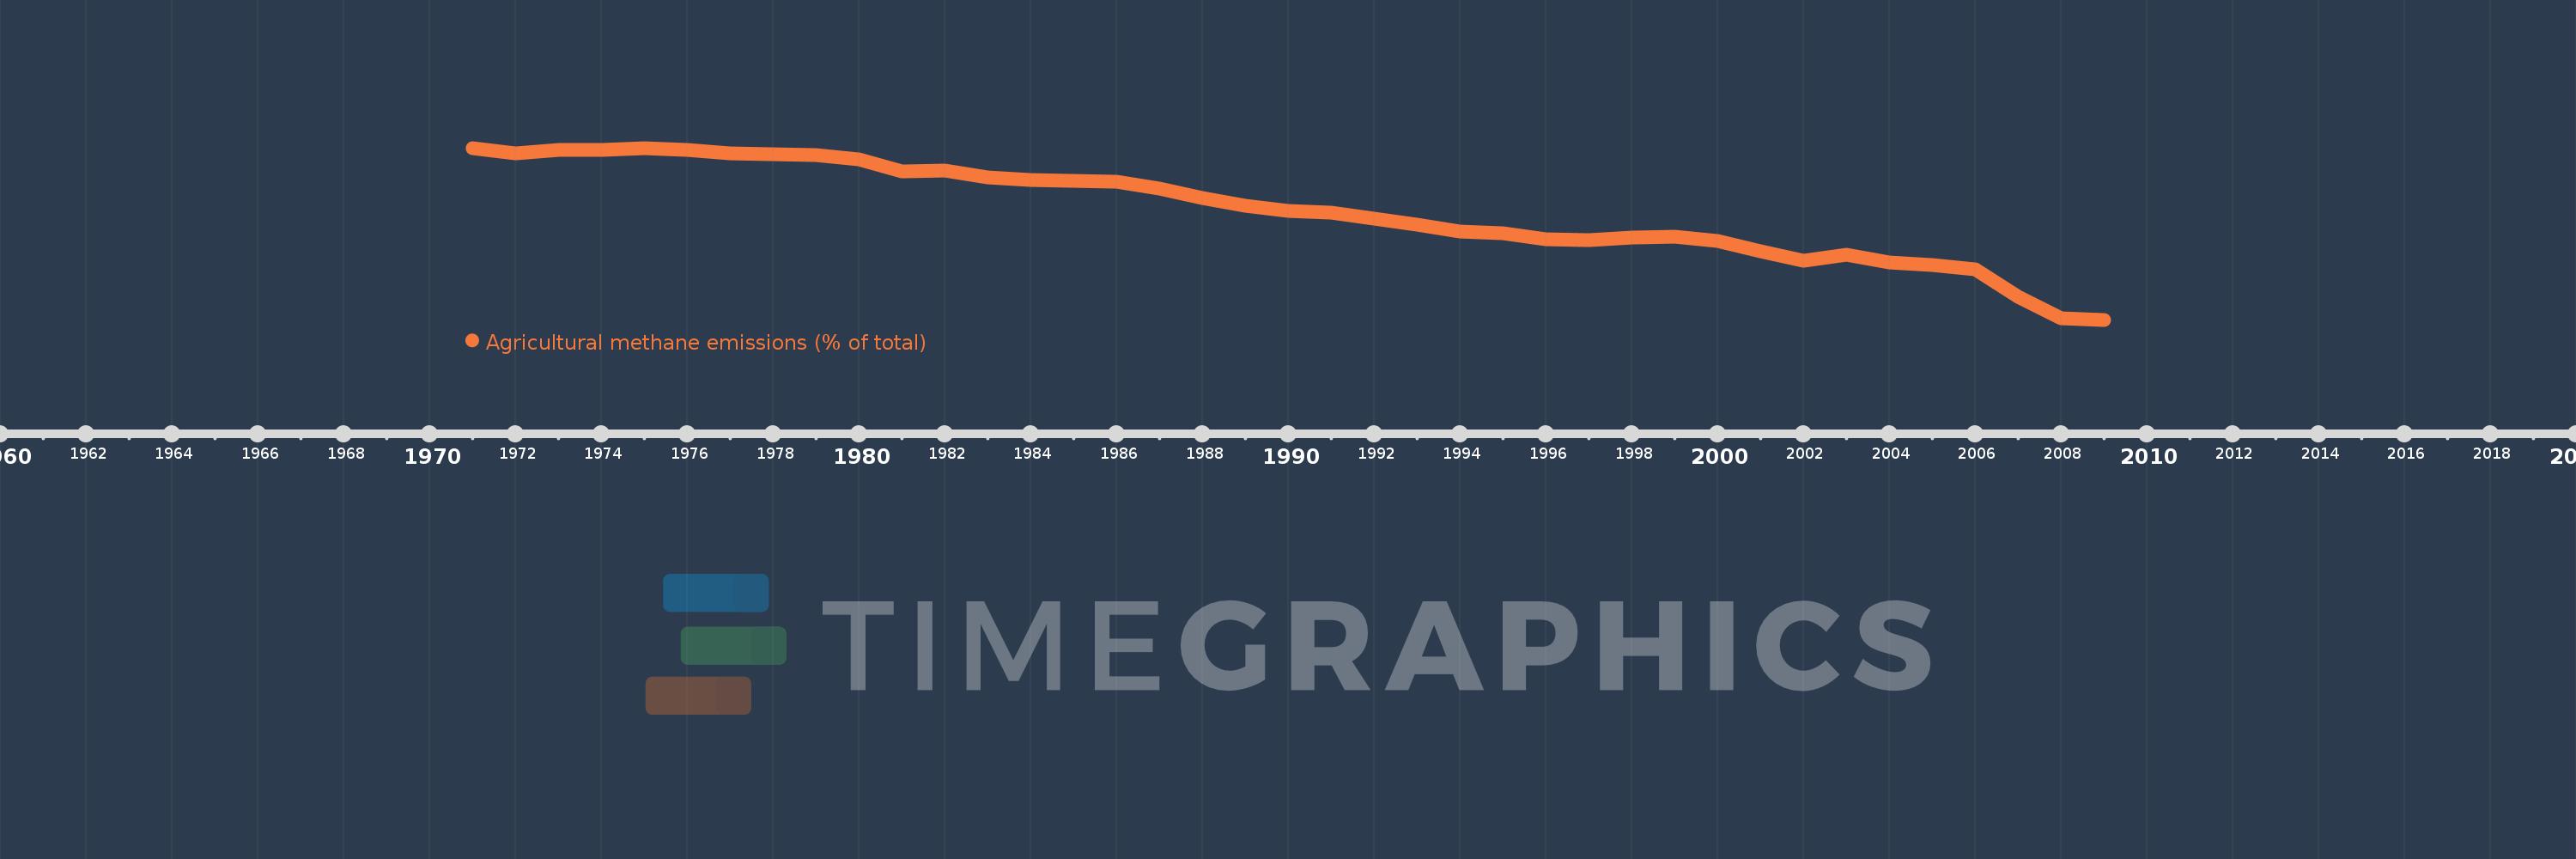
Agricultural methane emissions (% of total)
2009,2008,2007,2006,2005,2004,2003,2002,2001,2000,1999,1998,1997,1996,1995,1994,1993,1992,1991,1990,1989,1988,1987,1986,1985,1984,1983,1982,1981,1980,1979,1978,1977,1976,1975,1974,1973,1972,1971
This statistics in other country:
AfghanistanAlbaniaAlgeriaAmerican SamoaAngolaAntigua and BarbudaArab WorldArgentinaArmeniaArubaAustraliaAustriaAzerbaijanBahamas, TheBahrainBangladeshBarbadosBelarusBelgiumBelizeBeninBermudaBhutanBoliviaBosnia and HerzegovinaBotswanaBrazilBritish Virgin IslandsBrunei DarussalamBulgariaBurkina FasoBurundiCabo VerdeCambodiaCameroonCanadaCaribbean small statesCayman IslandsCentral African RepublicCentral Europe and the BalticsChadChileChinaColombiaComorosCongo, Dem. Rep.Congo, Rep.Costa RicaCote d'IvoireCroatiaCubaCyprusCzech RepublicDenmarkDjiboutiDominicaDominican RepublicEarly-demographic dividendEast Asia & PacificEast Asia & Pacific (excluding high income)East Asia & Pacific (IDA & IBRD countries)EcuadorEgypt, Arab Rep.El SalvadorEquatorial GuineaEritreaEstoniaEthiopiaEuro areaEurope & Central AsiaEurope & Central Asia (excluding high income)Europe & Central Asia (IDA & IBRD countries)European UnionFaroe IslandsFijiFinlandFragile and conflict affected situationsFranceFrench PolynesiaGabonGambia, TheGeorgiaGermanyGhanaGibraltarGreeceGreenlandGrenadaGuamGuatemalaGuineaGuinea-BissauGuyanaHaitiHeavily indebted poor countries (HIPC)High incomeHondurasHong Kong SAR, ChinaHungaryIBRD onlyIcelandIDA & IBRD totalIDA blendIDA onlyIDA totalIndiaIndonesiaIran, Islamic Rep.IraqIrelandIsraelItalyJamaicaJapanJordanKazakhstanKenyaKiribatiKorea, Dem. People’s Rep.Korea, Rep.KuwaitKyrgyz RepublicLao PDRLate-demographic dividendLatin America & Caribbean Latin America & Caribbean (excluding high income)Latin America & the Caribbean (IDA & IBRD countries)LatviaLeast developed countries: UN classificationLebanonLesothoLiberiaLibyaLithuaniaLow & middle incomeLow incomeLower middle incomeLuxembourgMacao SAR, ChinaMacedonia, FYRMadagascarMalawiMalaysiaMaldivesMaliMaltaMarshall IslandsMauritaniaMauritiusMexicoMicronesia, Fed. Sts.Middle East & North AfricaMiddle East & North Africa (excluding high income)Middle East & North Africa (IDA & IBRD countries)Middle incomeMoldovaMongoliaMoroccoMozambiqueMyanmarNamibiaNauruNepalNetherlandsNew CaledoniaNew ZealandNicaraguaNigerNigeriaNorth AmericaNorthern Mariana IslandsNorwayOECD membersOmanOther small statesPacific island small statesPakistanPalauPanamaPapua New GuineaParaguayPeruPhilippinesPolandPortugalPost-demographic dividendPre-demographic dividendPuerto RicoQatarRomaniaRussian FederationRwandaSamoaSao Tome and PrincipeSaudi ArabiaSenegalSerbiaSeychellesSierra LeoneSingaporeSlovak RepublicSloveniaSmall statesSolomon IslandsSomaliaSouth AfricaSouth AsiaSouth Asia (IDA & IBRD)SpainSri LankaSt. Kitts and NevisSt. LuciaSt. Vincent and the GrenadinesSub-Saharan Africa Sub-Saharan Africa (excluding high income)Sub-Saharan Africa (IDA & IBRD countries)SudanSurinameSwazilandSwedenSwitzerlandSyrian Arab RepublicTajikistanTanzaniaThailandTimor-LesteTogoTongaTrinidad and TobagoTunisiaTurkeyTurkmenistanTurks and Caicos IslandsTuvaluUgandaUkraineUnited Arab EmiratesUnited KingdomUnited StatesUpper middle incomeUruguayUzbekistanVanuatuVenezuela, RBVietnamVirgin Islands (U.S.)WorldYemen, Rep.ZambiaZimbabwe Timeline:
This timeline shows a graph from 1971 to 2009 of Iceland. No data until 1970. Number of actual observations by date: 39.
Source name:
World Development Indicators
Source organization:
World Bank staff estimates from original source: European Commission, Joint Research Centre (JRC)/Netherlands Environmental Assessment Agency (PBL). Emission Database for Global Atmospheric Research (EDGAR): http://edgar.jrc.ec.europa.eu/.
Categories, topics:
Agriculture & Rural Development, Environment
Last updated:
apr 23, 2017
Indicators value changes by year
Minimum:
56.985
jan 1, 2009
Maximum:
80.839
jan 1, 1971
At the date of observation
Value
Absolute change
Change from previous value
jan 1, 1971
80.839
+80.839
0.0%
jan 1, 1972
80.135
-0.703
-0.87%
jan 1, 1973
80.543
+0.408
0.51%
jan 1, 1974
80.533
-0.011
-0.01%
jan 1, 1975
80.81
+0.278
0.34%
jan 1, 1976
80.547
-0.263
-0.33%
jan 1, 1977
80.053
-0.494
-0.61%
jan 1, 1978
79.934
-0.119
-0.15%
jan 1, 1979
79.816
-0.117
-0.15%
jan 1, 1980
79.232
-0.584
-0.73%
jan 1, 1981
77.587
-1.645
-2.08%
jan 1, 1982
77.659
+0.072
0.09%
jan 1, 1983
76.769
-0.89
-1.15%
jan 1, 1984
76.406
-0.363
-0.47%
jan 1, 1985
76.248
-0.158
-0.21%
jan 1, 1986
76.149
-0.099
-0.13%
jan 1, 1987
75.224
-0.926
-1.22%
jan 1, 1988
73.904
-1.319
-1.75%
jan 1, 1989
72.791
-1.113
-1.51%
jan 1, 1990
72.06
-0.731
-1.0%
jan 1, 1991
71.799
-0.261
-0.36%
jan 1, 1992
71.076
-0.723
-1.01%
jan 1, 1993
70.164
-0.912
-1.28%
jan 1, 1994
69.179
-0.985
-1.4%
jan 1, 1995
68.956
-0.223
-0.32%
jan 1, 1996
68.177
-0.779
-1.13%
jan 1, 1997
68.01
-0.167
-0.24%
jan 1, 1998
68.344
+0.333
0.49%
jan 1, 1999
68.563
+0.22
0.32%
jan 1, 2000
67.968
-0.596
-0.87%
jan 1, 2001
66.487
-1.481
-2.18%
jan 1, 2002
65.172
-1.315
-1.98%
jan 1, 2003
66.048
+0.876
1.34%
jan 1, 2004
64.919
-1.129
-1.71%
jan 1, 2005
64.584
-0.335
-0.52%
jan 1, 2006
63.991
-0.594
-0.92%
jan 1, 2007
60.139
-3.852
-6.02%
jan 1, 2008
57.217
-2.922
-4.86%
jan 1, 2009
56.985
-0.232
-0.4%
Ranking of countries by current statistics by years


Comments: