29
/
en
AIzaSyAYiBZKx7MnpbEhh9jyipgxe19OcubqV5w
April 1, 2024
286817
Zimbabwe
ZWE
true
2
1
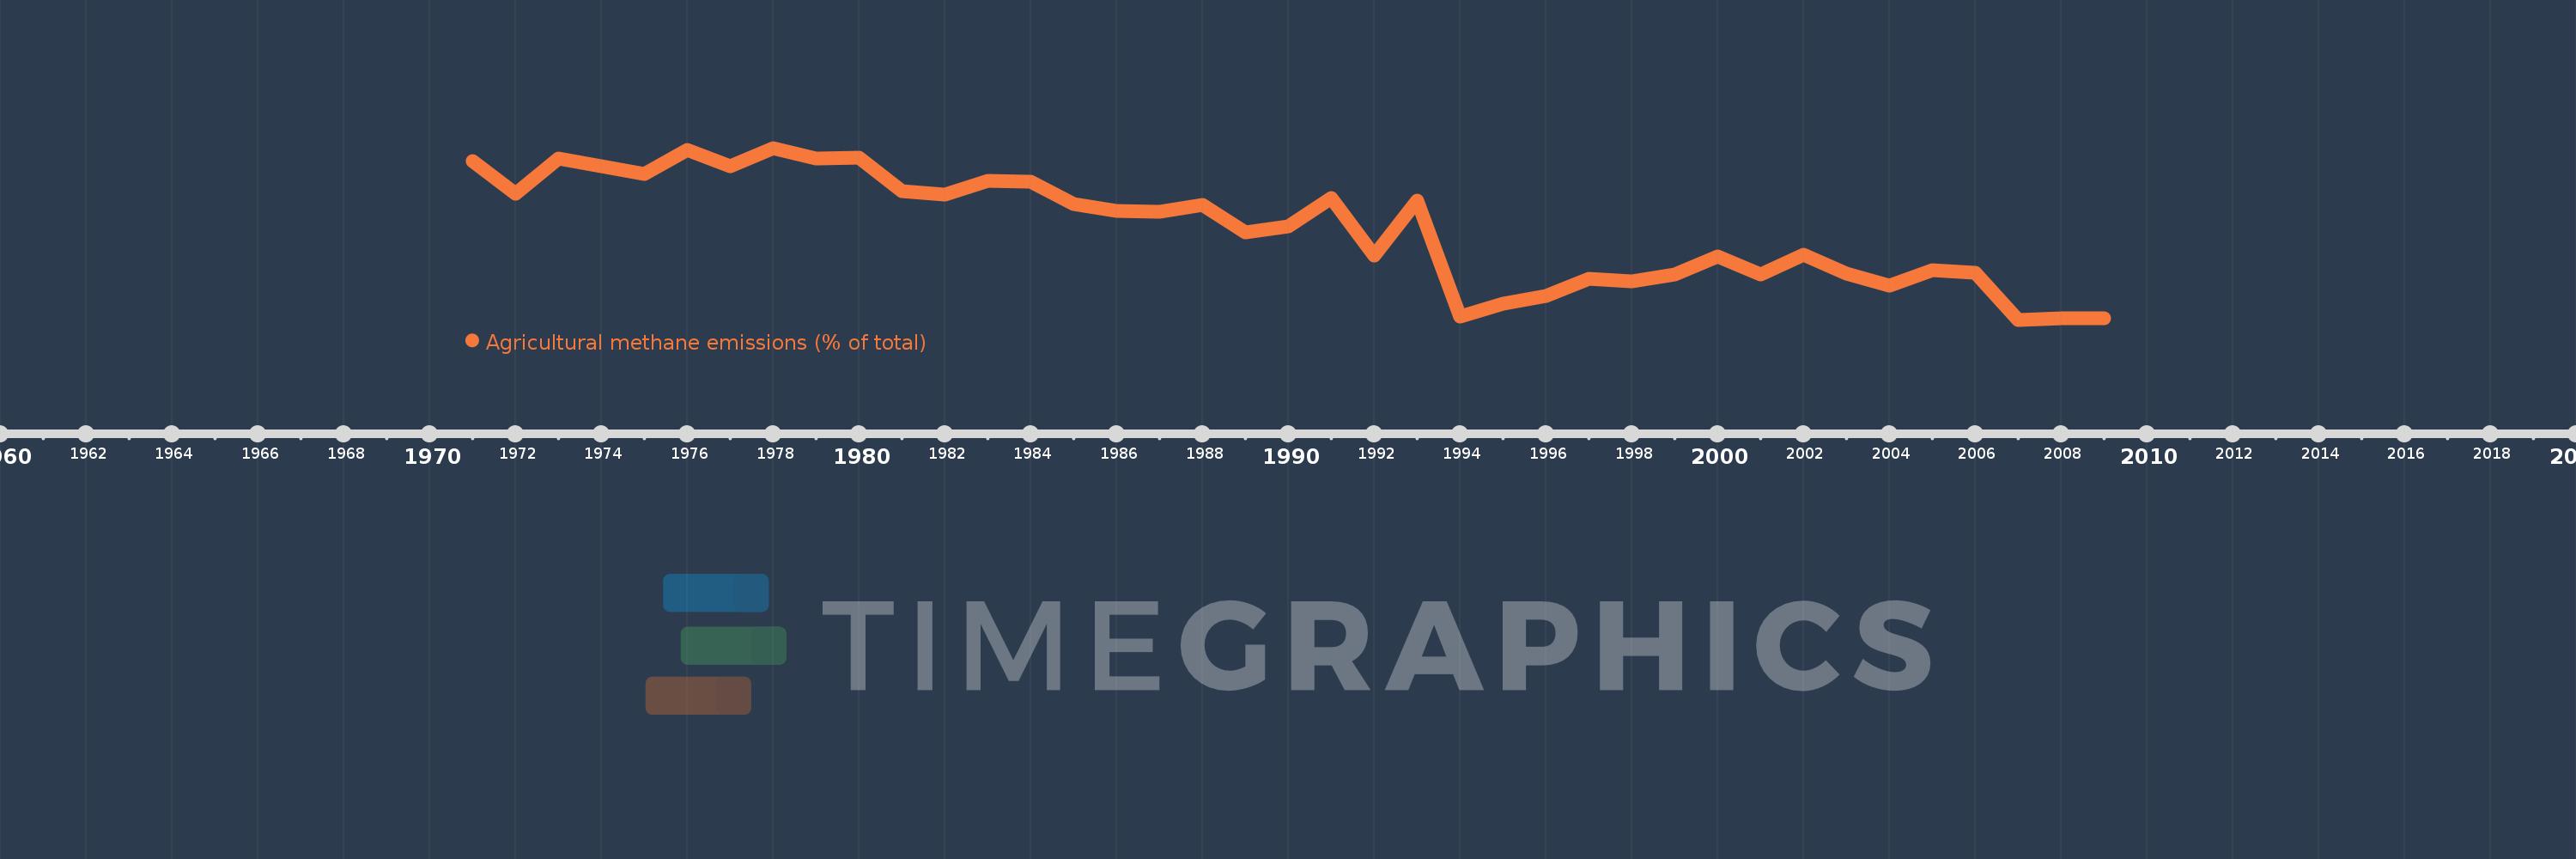
Agricultural methane emissions (% of total)
2009,2008,2007,2006,2005,2004,2003,2002,2001,2000,1999,1998,1997,1996,1995,1994,1993,1992,1991,1990,1989,1988,1987,1986,1985,1984,1983,1982,1981,1980,1979,1978,1977,1976,1975,1974,1973,1972,1971
This statistics in other country:
AfghanistanAlbaniaAlgeriaAmerican SamoaAngolaAntigua and BarbudaArab WorldArgentinaArmeniaArubaAustraliaAustriaAzerbaijanBahamas, TheBahrainBangladeshBarbadosBelarusBelgiumBelizeBeninBermudaBhutanBoliviaBosnia and HerzegovinaBotswanaBrazilBritish Virgin IslandsBrunei DarussalamBulgariaBurkina FasoBurundiCabo VerdeCambodiaCameroonCanadaCaribbean small statesCayman IslandsCentral African RepublicCentral Europe and the BalticsChadChileChinaColombiaComorosCongo, Dem. Rep.Congo, Rep.Costa RicaCote d'IvoireCroatiaCubaCyprusCzech RepublicDenmarkDjiboutiDominicaDominican RepublicEarly-demographic dividendEast Asia & PacificEast Asia & Pacific (excluding high income)East Asia & Pacific (IDA & IBRD countries)EcuadorEgypt, Arab Rep.El SalvadorEquatorial GuineaEritreaEstoniaEthiopiaEuro areaEurope & Central AsiaEurope & Central Asia (excluding high income)Europe & Central Asia (IDA & IBRD countries)European UnionFaroe IslandsFijiFinlandFragile and conflict affected situationsFranceFrench PolynesiaGabonGambia, TheGeorgiaGermanyGhanaGibraltarGreeceGreenlandGrenadaGuamGuatemalaGuineaGuinea-BissauGuyanaHaitiHeavily indebted poor countries (HIPC)High incomeHondurasHong Kong SAR, ChinaHungaryIBRD onlyIcelandIDA & IBRD totalIDA blendIDA onlyIDA totalIndiaIndonesiaIran, Islamic Rep.IraqIrelandIsraelItalyJamaicaJapanJordanKazakhstanKenyaKiribatiKorea, Dem. People’s Rep.Korea, Rep.KuwaitKyrgyz RepublicLao PDRLate-demographic dividendLatin America & Caribbean Latin America & Caribbean (excluding high income)Latin America & the Caribbean (IDA & IBRD countries)LatviaLeast developed countries: UN classificationLebanonLesothoLiberiaLibyaLithuaniaLow & middle incomeLow incomeLower middle incomeLuxembourgMacao SAR, ChinaMacedonia, FYRMadagascarMalawiMalaysiaMaldivesMaliMaltaMarshall IslandsMauritaniaMauritiusMexicoMicronesia, Fed. Sts.Middle East & North AfricaMiddle East & North Africa (excluding high income)Middle East & North Africa (IDA & IBRD countries)Middle incomeMoldovaMongoliaMoroccoMozambiqueMyanmarNamibiaNauruNepalNetherlandsNew CaledoniaNew ZealandNicaraguaNigerNigeriaNorth AmericaNorthern Mariana IslandsNorwayOECD membersOmanOther small statesPacific island small statesPakistanPalauPanamaPapua New GuineaParaguayPeruPhilippinesPolandPortugalPost-demographic dividendPre-demographic dividendPuerto RicoQatarRomaniaRussian FederationRwandaSamoaSao Tome and PrincipeSaudi ArabiaSenegalSerbiaSeychellesSierra LeoneSingaporeSlovak RepublicSloveniaSmall statesSolomon IslandsSomaliaSouth AfricaSouth AsiaSouth Asia (IDA & IBRD)SpainSri LankaSt. Kitts and NevisSt. LuciaSt. Vincent and the GrenadinesSub-Saharan Africa Sub-Saharan Africa (excluding high income)Sub-Saharan Africa (IDA & IBRD countries)SudanSurinameSwazilandSwedenSwitzerlandSyrian Arab RepublicTajikistanTanzaniaThailandTimor-LesteTogoTongaTrinidad and TobagoTunisiaTurkeyTurkmenistanTurks and Caicos IslandsTuvaluUgandaUkraineUnited Arab EmiratesUnited KingdomUnited StatesUpper middle incomeUruguayUzbekistanVanuatuVenezuela, RBVietnamVirgin Islands (U.S.)WorldYemen, Rep.ZambiaZimbabwe Timeline:
This timeline shows a graph from 1971 to 2009 of Zimbabwe. No data until 1970. Number of actual observations by date: 39.
Source name:
World Development Indicators
Source organization:
World Bank staff estimates from original source: European Commission, Joint Research Centre (JRC)/Netherlands Environmental Assessment Agency (PBL). Emission Database for Global Atmospheric Research (EDGAR): http://edgar.jrc.ec.europa.eu/.
Categories, topics:
Agriculture & Rural Development, Environment
Last updated:
apr 23, 2017
Indicators value changes by year
Maximum:
83.338
jan 1, 1978
At the date of observation
Value
Absolute change
Change from previous value
jan 1, 1971
82.302
+82.302
0.0%
jan 1, 1972
79.712
-2.591
-3.15%
jan 1, 1973
82.488
+2.777
3.48%
jan 1, 1974
81.896
-0.593
-0.72%
jan 1, 1975
81.27
-0.626
-0.76%
jan 1, 1976
83.197
+1.927
2.37%
jan 1, 1977
81.903
-1.294
-1.55%
jan 1, 1978
83.338
+1.435
1.75%
jan 1, 1979
82.489
-0.849
-1.02%
jan 1, 1980
82.538
+0.049
0.06%
jan 1, 1981
79.906
-2.633
-3.19%
jan 1, 1982
79.657
-0.249
-0.31%
jan 1, 1983
80.761
+1.103
1.39%
jan 1, 1984
80.663
-0.098
-0.12%
jan 1, 1985
78.891
-1.772
-2.2%
jan 1, 1986
78.395
-0.496
-0.63%
jan 1, 1987
78.324
-0.072
-0.09%
jan 1, 1988
78.832
+0.508
0.65%
jan 1, 1989
76.651
-2.18
-2.77%
jan 1, 1990
77.142
+0.49
0.64%
jan 1, 1991
79.367
+2.225
2.88%
jan 1, 1992
74.862
-4.505
-5.68%
jan 1, 1993
79.16
+4.299
5.74%
jan 1, 1994
70.017
-9.143
-11.55%
jan 1, 1995
71.017
+1.0
1.43%
jan 1, 1996
71.618
+0.602
0.85%
jan 1, 1997
73.017
+1.399
1.95%
jan 1, 1998
72.805
-0.212
-0.29%
jan 1, 1999
73.315
+0.511
0.7%
jan 1, 2000
74.74
+1.425
1.94%
jan 1, 2001
73.309
-1.431
-1.91%
jan 1, 2002
74.892
+1.582
2.16%
jan 1, 2003
73.425
-1.466
-1.96%
jan 1, 2004
72.464
-0.961
-1.31%
jan 1, 2005
73.678
+1.214
1.68%
jan 1, 2006
73.507
-0.171
-0.23%
jan 1, 2007
69.76
-3.748
-5.1%
jan 1, 2008
69.851
+0.091
0.13%
jan 1, 2009
69.844
-0.007
-0.01%
Ranking of countries by current statistics by years


Comments: