29
/
en
AIzaSyAYiBZKx7MnpbEhh9jyipgxe19OcubqV5w
April 1, 2024
133830
France
FRA
true
2
1
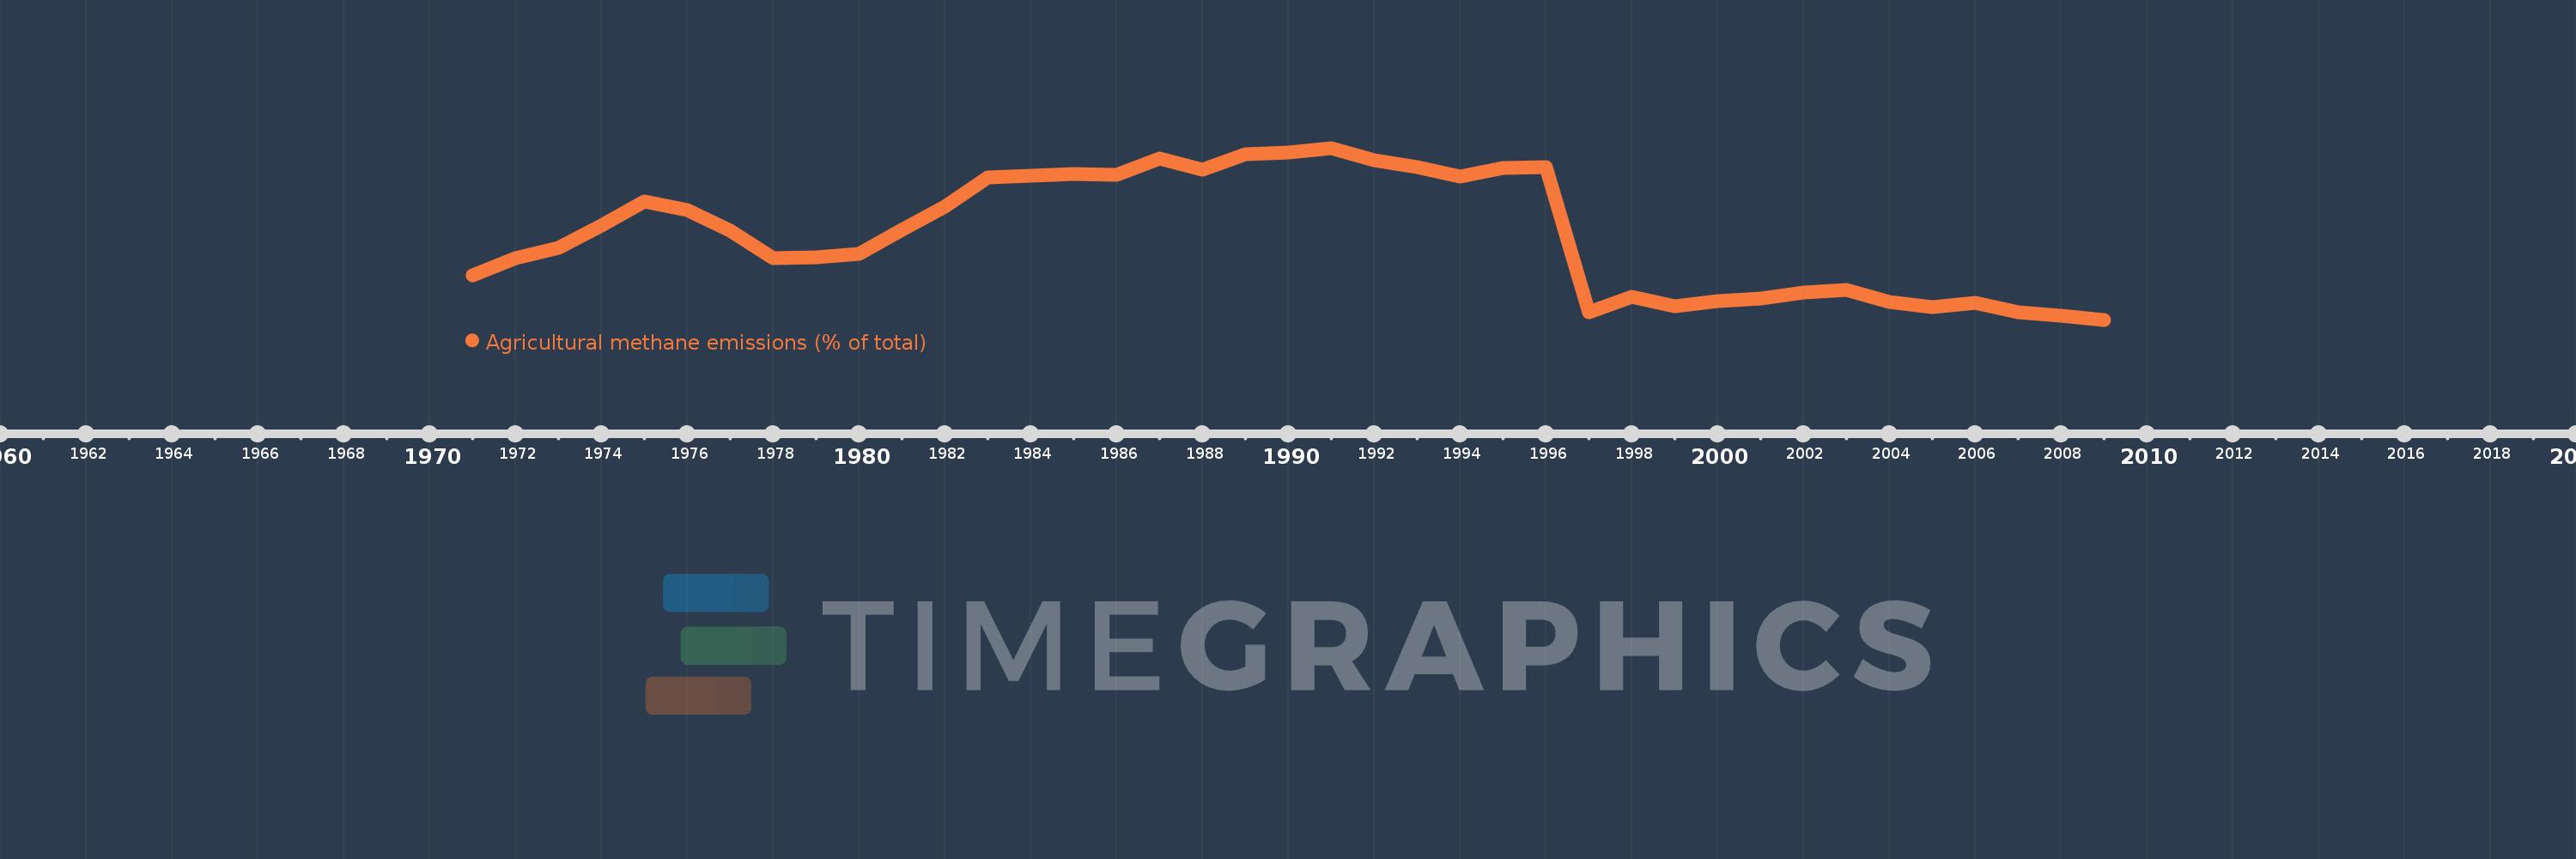
Agricultural methane emissions (% of total)
2009,2008,2007,2006,2005,2004,2003,2002,2001,2000,1999,1998,1997,1996,1995,1994,1993,1992,1991,1990,1989,1988,1987,1986,1985,1984,1983,1982,1981,1980,1979,1978,1977,1976,1975,1974,1973,1972,1971
This statistics in other country:
AfghanistanAlbaniaAlgeriaAmerican SamoaAngolaAntigua and BarbudaArab WorldArgentinaArmeniaArubaAustraliaAustriaAzerbaijanBahamas, TheBahrainBangladeshBarbadosBelarusBelgiumBelizeBeninBermudaBhutanBoliviaBosnia and HerzegovinaBotswanaBrazilBritish Virgin IslandsBrunei DarussalamBulgariaBurkina FasoBurundiCabo VerdeCambodiaCameroonCanadaCaribbean small statesCayman IslandsCentral African RepublicCentral Europe and the BalticsChadChileChinaColombiaComorosCongo, Dem. Rep.Congo, Rep.Costa RicaCote d'IvoireCroatiaCubaCyprusCzech RepublicDenmarkDjiboutiDominicaDominican RepublicEarly-demographic dividendEast Asia & PacificEast Asia & Pacific (excluding high income)East Asia & Pacific (IDA & IBRD countries)EcuadorEgypt, Arab Rep.El SalvadorEquatorial GuineaEritreaEstoniaEthiopiaEuro areaEurope & Central AsiaEurope & Central Asia (excluding high income)Europe & Central Asia (IDA & IBRD countries)European UnionFaroe IslandsFijiFinlandFragile and conflict affected situationsFranceFrench PolynesiaGabonGambia, TheGeorgiaGermanyGhanaGibraltarGreeceGreenlandGrenadaGuamGuatemalaGuineaGuinea-BissauGuyanaHaitiHeavily indebted poor countries (HIPC)High incomeHondurasHong Kong SAR, ChinaHungaryIBRD onlyIcelandIDA & IBRD totalIDA blendIDA onlyIDA totalIndiaIndonesiaIran, Islamic Rep.IraqIrelandIsraelItalyJamaicaJapanJordanKazakhstanKenyaKiribatiKorea, Dem. People’s Rep.Korea, Rep.KuwaitKyrgyz RepublicLao PDRLate-demographic dividendLatin America & Caribbean Latin America & Caribbean (excluding high income)Latin America & the Caribbean (IDA & IBRD countries)LatviaLeast developed countries: UN classificationLebanonLesothoLiberiaLibyaLithuaniaLow & middle incomeLow incomeLower middle incomeLuxembourgMacao SAR, ChinaMacedonia, FYRMadagascarMalawiMalaysiaMaldivesMaliMaltaMarshall IslandsMauritaniaMauritiusMexicoMicronesia, Fed. Sts.Middle East & North AfricaMiddle East & North Africa (excluding high income)Middle East & North Africa (IDA & IBRD countries)Middle incomeMoldovaMongoliaMoroccoMozambiqueMyanmarNamibiaNauruNepalNetherlandsNew CaledoniaNew ZealandNicaraguaNigerNigeriaNorth AmericaNorthern Mariana IslandsNorwayOECD membersOmanOther small statesPacific island small statesPakistanPalauPanamaPapua New GuineaParaguayPeruPhilippinesPolandPortugalPost-demographic dividendPre-demographic dividendPuerto RicoQatarRomaniaRussian FederationRwandaSamoaSao Tome and PrincipeSaudi ArabiaSenegalSerbiaSeychellesSierra LeoneSingaporeSlovak RepublicSloveniaSmall statesSolomon IslandsSomaliaSouth AfricaSouth AsiaSouth Asia (IDA & IBRD)SpainSri LankaSt. Kitts and NevisSt. LuciaSt. Vincent and the GrenadinesSub-Saharan Africa Sub-Saharan Africa (excluding high income)Sub-Saharan Africa (IDA & IBRD countries)SudanSurinameSwazilandSwedenSwitzerlandSyrian Arab RepublicTajikistanTanzaniaThailandTimor-LesteTogoTongaTrinidad and TobagoTunisiaTurkeyTurkmenistanTurks and Caicos IslandsTuvaluUgandaUkraineUnited Arab EmiratesUnited KingdomUnited StatesUpper middle incomeUruguayUzbekistanVanuatuVenezuela, RBVietnamVirgin Islands (U.S.)WorldYemen, Rep.ZambiaZimbabwe Timeline:
This timeline shows a graph from 1971 to 2009 of France. No data until 1970. Number of actual observations by date: 39.
Source name:
World Development Indicators
Source organization:
World Bank staff estimates from original source: European Commission, Joint Research Centre (JRC)/Netherlands Environmental Assessment Agency (PBL). Emission Database for Global Atmospheric Research (EDGAR): http://edgar.jrc.ec.europa.eu/.
Categories, topics:
Agriculture & Rural Development, Environment
Last updated:
apr 23, 2017
Indicators value changes by year
Minimum:
43.452
jan 1, 2009
Maximum:
53.761
jan 1, 1991
At the date of observation
Value
Absolute change
Change from previous value
jan 1, 1971
46.104
+46.104
0.0%
jan 1, 1972
47.139
+1.035
2.24%
jan 1, 1973
47.791
+0.652
1.38%
jan 1, 1974
49.132
+1.342
2.81%
jan 1, 1975
50.566
+1.434
2.92%
jan 1, 1976
50.027
-0.54
-1.07%
jan 1, 1977
48.791
-1.236
-2.47%
jan 1, 1978
47.164
-1.627
-3.33%
jan 1, 1979
47.208
+0.043
0.09%
jan 1, 1980
47.422
+0.214
0.45%
jan 1, 1981
48.863
+1.441
3.04%
jan 1, 1982
50.236
+1.372
2.81%
jan 1, 1983
51.994
+1.759
3.5%
jan 1, 1984
52.1
+0.106
0.2%
jan 1, 1985
52.208
+0.108
0.21%
jan 1, 1986
52.137
-0.071
-0.14%
jan 1, 1987
53.108
+0.971
1.86%
jan 1, 1988
52.456
-0.652
-1.23%
jan 1, 1989
53.373
+0.917
1.75%
jan 1, 1990
53.504
+0.131
0.25%
jan 1, 1991
53.761
+0.257
0.48%
jan 1, 1992
53.001
-0.76
-1.41%
jan 1, 1993
52.62
-0.381
-0.72%
jan 1, 1994
52.024
-0.596
-1.13%
jan 1, 1995
52.546
+0.522
1.0%
jan 1, 1996
52.601
+0.054
0.1%
jan 1, 1997
43.925
-8.676
-16.49%
jan 1, 1998
44.85
+0.926
2.11%
jan 1, 1999
44.258
-0.593
-1.32%
jan 1, 2000
44.595
+0.337
0.76%
jan 1, 2001
44.728
+0.133
0.3%
jan 1, 2002
45.076
+0.348
0.78%
jan 1, 2003
45.247
+0.171
0.38%
jan 1, 2004
44.539
-0.708
-1.56%
jan 1, 2005
44.213
-0.326
-0.73%
jan 1, 2006
44.489
+0.275
0.62%
jan 1, 2007
43.906
-0.583
-1.31%
jan 1, 2008
43.701
-0.205
-0.47%
jan 1, 2009
43.452
-0.249
-0.57%
Ranking of countries by current statistics by years


Comments: