29
/
en
AIzaSyAYiBZKx7MnpbEhh9jyipgxe19OcubqV5w
April 1, 2024
209052
New Zealand
NZL
true
2
1
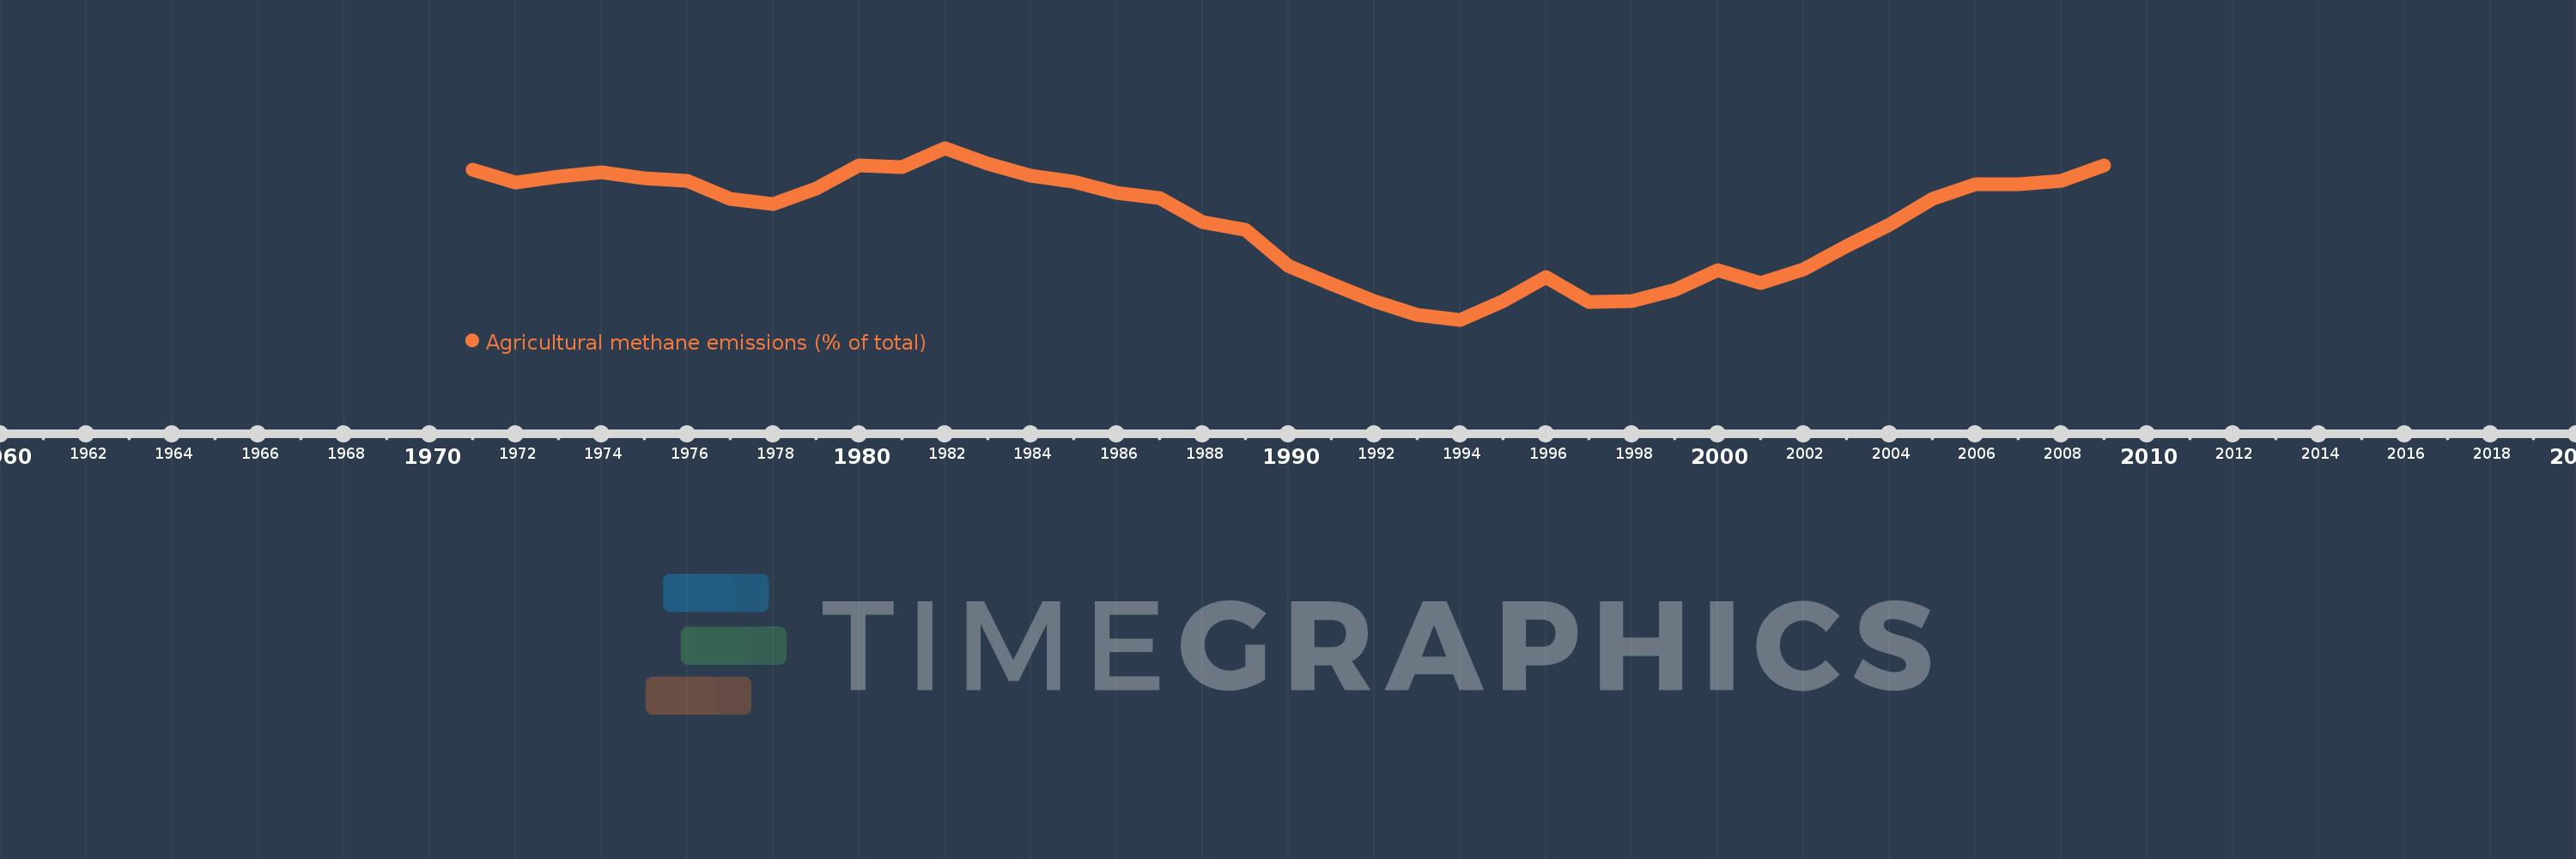
Agricultural methane emissions (% of total)
2009,2008,2007,2006,2005,2004,2003,2002,2001,2000,1999,1998,1997,1996,1995,1994,1993,1992,1991,1990,1989,1988,1987,1986,1985,1984,1983,1982,1981,1980,1979,1978,1977,1976,1975,1974,1973,1972,1971
This statistics in other country:
AfghanistanAlbaniaAlgeriaAmerican SamoaAngolaAntigua and BarbudaArab WorldArgentinaArmeniaArubaAustraliaAustriaAzerbaijanBahamas, TheBahrainBangladeshBarbadosBelarusBelgiumBelizeBeninBermudaBhutanBoliviaBosnia and HerzegovinaBotswanaBrazilBritish Virgin IslandsBrunei DarussalamBulgariaBurkina FasoBurundiCabo VerdeCambodiaCameroonCanadaCaribbean small statesCayman IslandsCentral African RepublicCentral Europe and the BalticsChadChileChinaColombiaComorosCongo, Dem. Rep.Congo, Rep.Costa RicaCote d'IvoireCroatiaCubaCyprusCzech RepublicDenmarkDjiboutiDominicaDominican RepublicEarly-demographic dividendEast Asia & PacificEast Asia & Pacific (excluding high income)East Asia & Pacific (IDA & IBRD countries)EcuadorEgypt, Arab Rep.El SalvadorEquatorial GuineaEritreaEstoniaEthiopiaEuro areaEurope & Central AsiaEurope & Central Asia (excluding high income)Europe & Central Asia (IDA & IBRD countries)European UnionFaroe IslandsFijiFinlandFragile and conflict affected situationsFranceFrench PolynesiaGabonGambia, TheGeorgiaGermanyGhanaGibraltarGreeceGreenlandGrenadaGuamGuatemalaGuineaGuinea-BissauGuyanaHaitiHeavily indebted poor countries (HIPC)High incomeHondurasHong Kong SAR, ChinaHungaryIBRD onlyIcelandIDA & IBRD totalIDA blendIDA onlyIDA totalIndiaIndonesiaIran, Islamic Rep.IraqIrelandIsraelItalyJamaicaJapanJordanKazakhstanKenyaKiribatiKorea, Dem. People’s Rep.Korea, Rep.KuwaitKyrgyz RepublicLao PDRLate-demographic dividendLatin America & Caribbean Latin America & Caribbean (excluding high income)Latin America & the Caribbean (IDA & IBRD countries)LatviaLeast developed countries: UN classificationLebanonLesothoLiberiaLibyaLithuaniaLow & middle incomeLow incomeLower middle incomeLuxembourgMacao SAR, ChinaMacedonia, FYRMadagascarMalawiMalaysiaMaldivesMaliMaltaMarshall IslandsMauritaniaMauritiusMexicoMicronesia, Fed. Sts.Middle East & North AfricaMiddle East & North Africa (excluding high income)Middle East & North Africa (IDA & IBRD countries)Middle incomeMoldovaMongoliaMoroccoMozambiqueMyanmarNamibiaNauruNepalNetherlandsNew CaledoniaNew ZealandNicaraguaNigerNigeriaNorth AmericaNorthern Mariana IslandsNorwayOECD membersOmanOther small statesPacific island small statesPakistanPalauPanamaPapua New GuineaParaguayPeruPhilippinesPolandPortugalPost-demographic dividendPre-demographic dividendPuerto RicoQatarRomaniaRussian FederationRwandaSamoaSao Tome and PrincipeSaudi ArabiaSenegalSerbiaSeychellesSierra LeoneSingaporeSlovak RepublicSloveniaSmall statesSolomon IslandsSomaliaSouth AfricaSouth AsiaSouth Asia (IDA & IBRD)SpainSri LankaSt. Kitts and NevisSt. LuciaSt. Vincent and the GrenadinesSub-Saharan Africa Sub-Saharan Africa (excluding high income)Sub-Saharan Africa (IDA & IBRD countries)SudanSurinameSwazilandSwedenSwitzerlandSyrian Arab RepublicTajikistanTanzaniaThailandTimor-LesteTogoTongaTrinidad and TobagoTunisiaTurkeyTurkmenistanTurks and Caicos IslandsTuvaluUgandaUkraineUnited Arab EmiratesUnited KingdomUnited StatesUpper middle incomeUruguayUzbekistanVanuatuVenezuela, RBVietnamVirgin Islands (U.S.)WorldYemen, Rep.ZambiaZimbabwe Timeline:
This timeline shows a graph from 1971 to 2009 of New Zealand. No data until 1970. Number of actual observations by date: 39.
Source name:
World Development Indicators
Source organization:
World Bank staff estimates from original source: European Commission, Joint Research Centre (JRC)/Netherlands Environmental Assessment Agency (PBL). Emission Database for Global Atmospheric Research (EDGAR): http://edgar.jrc.ec.europa.eu/.
Categories, topics:
Agriculture & Rural Development, Environment
Last updated:
apr 23, 2017
Indicators value changes by year
Minimum:
87.774
jan 1, 1994
Maximum:
91.317
jan 1, 1982
At the date of observation
Value
Absolute change
Change from previous value
jan 1, 1971
90.868
+90.868
0.0%
jan 1, 1972
90.6
-0.268
-0.29%
jan 1, 1973
90.735
+0.135
0.15%
jan 1, 1974
90.823
+0.089
0.1%
jan 1, 1975
90.691
-0.132
-0.15%
jan 1, 1976
90.642
-0.049
-0.05%
jan 1, 1977
90.271
-0.371
-0.41%
jan 1, 1978
90.153
-0.118
-0.13%
jan 1, 1979
90.483
+0.33
0.37%
jan 1, 1980
90.951
+0.468
0.52%
jan 1, 1981
90.916
-0.035
-0.04%
jan 1, 1982
91.317
+0.402
0.44%
jan 1, 1983
90.987
-0.33
-0.36%
jan 1, 1984
90.741
-0.246
-0.27%
jan 1, 1985
90.617
-0.124
-0.14%
jan 1, 1986
90.399
-0.218
-0.24%
jan 1, 1987
90.281
-0.118
-0.13%
jan 1, 1988
89.78
-0.501
-0.56%
jan 1, 1989
89.628
-0.152
-0.17%
jan 1, 1990
88.882
-0.745
-0.83%
jan 1, 1991
88.514
-0.369
-0.41%
jan 1, 1992
88.159
-0.354
-0.4%
jan 1, 1993
87.871
-0.289
-0.33%
jan 1, 1994
87.774
-0.096
-0.11%
jan 1, 1995
88.162
+0.388
0.44%
jan 1, 1996
88.656
+0.494
0.56%
jan 1, 1997
88.132
-0.524
-0.59%
jan 1, 1998
88.156
+0.024
0.03%
jan 1, 1999
88.396
+0.239
0.27%
jan 1, 2000
88.79
+0.395
0.45%
jan 1, 2001
88.526
-0.264
-0.3%
jan 1, 2002
88.81
+0.284
0.32%
jan 1, 2003
89.285
+0.474
0.53%
jan 1, 2004
89.73
+0.445
0.5%
jan 1, 2005
90.268
+0.539
0.6%
jan 1, 2006
90.567
+0.299
0.33%
jan 1, 2007
90.571
+0.003
0.0%
jan 1, 2008
90.637
+0.066
0.07%
jan 1, 2009
90.966
+0.329
0.36%
Ranking of countries by current statistics by years


Comments: