29
/
en
AIzaSyAYiBZKx7MnpbEhh9jyipgxe19OcubqV5w
April 1, 2024
69446
Argentina
ARG
true
2
1
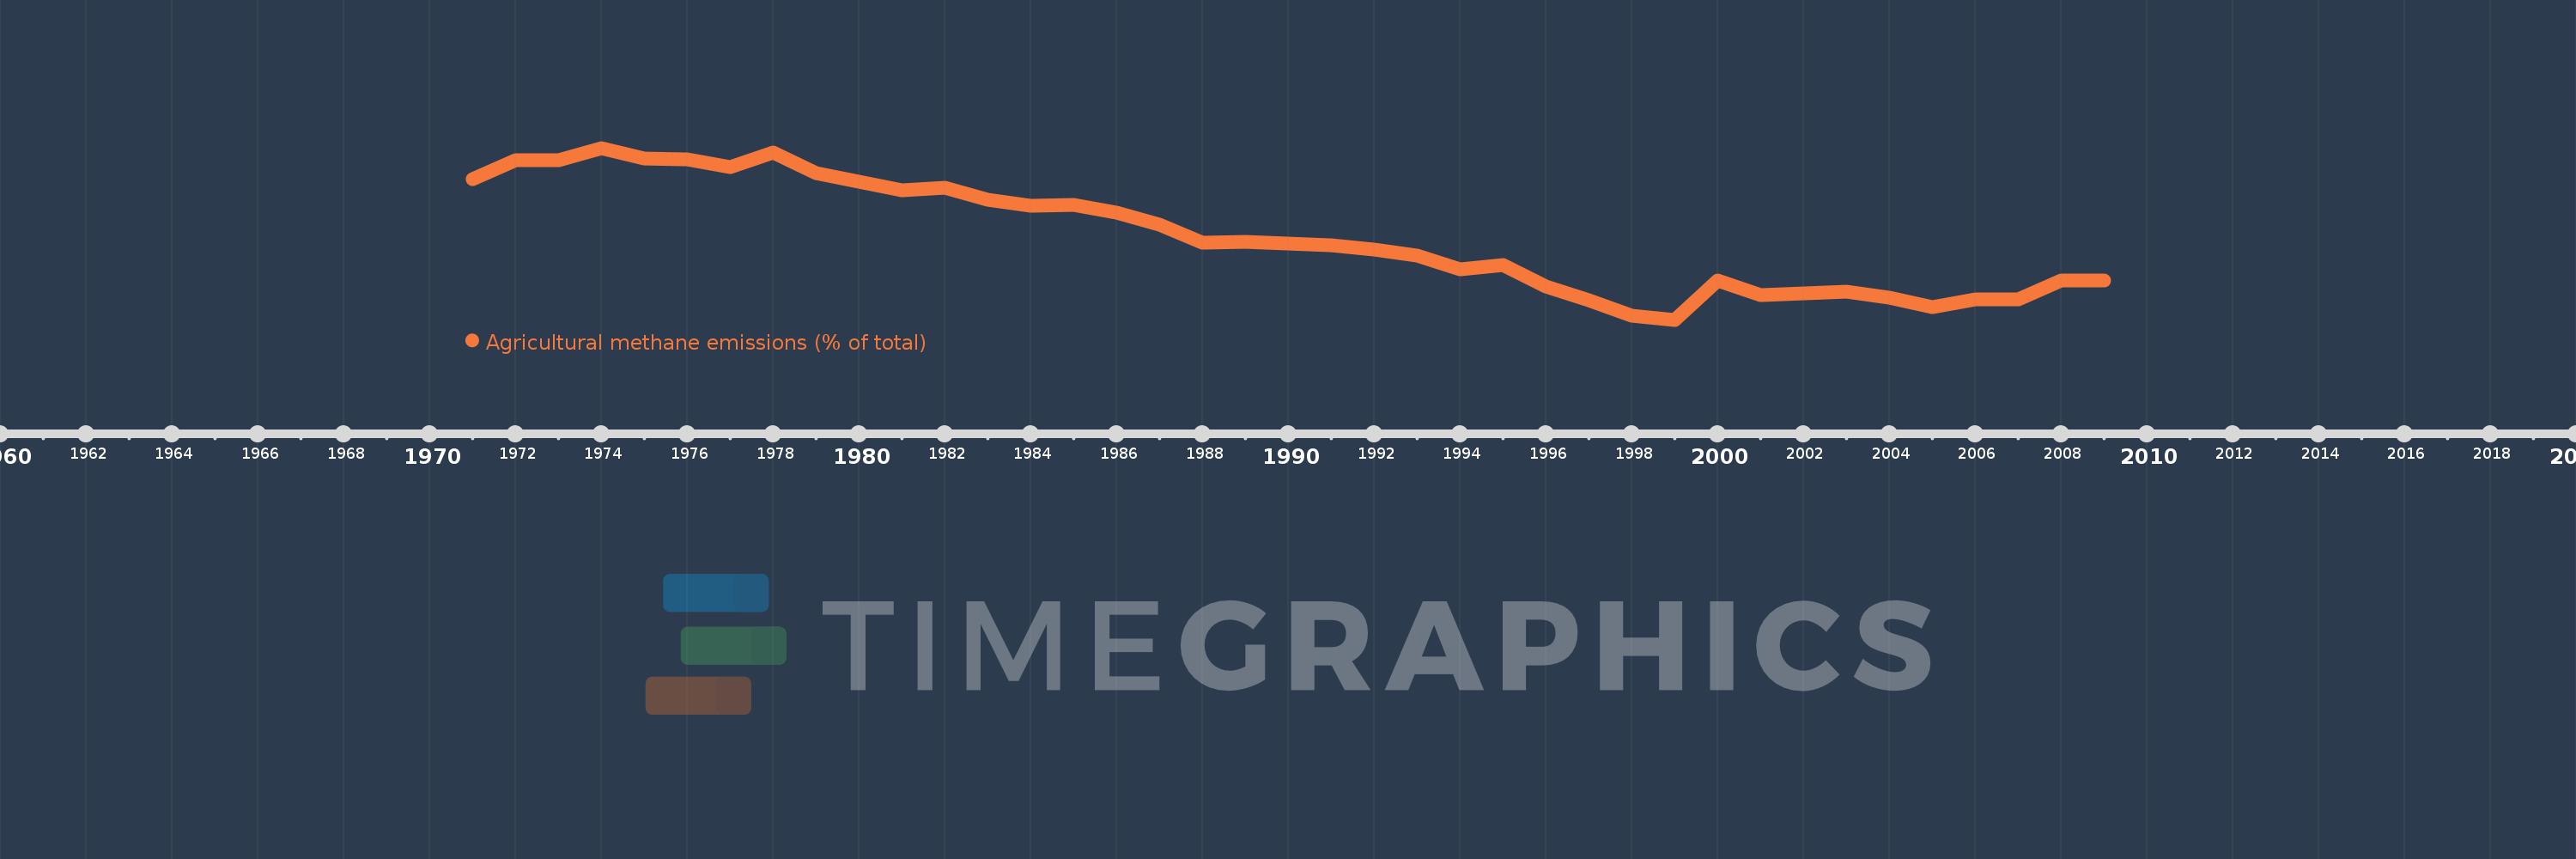
Agricultural methane emissions (% of total)
2009,2008,2007,2006,2005,2004,2003,2002,2001,2000,1999,1998,1997,1996,1995,1994,1993,1992,1991,1990,1989,1988,1987,1986,1985,1984,1983,1982,1981,1980,1979,1978,1977,1976,1975,1974,1973,1972,1971
This statistics in other country:
AfghanistanAlbaniaAlgeriaAmerican SamoaAngolaAntigua and BarbudaArab WorldArgentinaArmeniaArubaAustraliaAustriaAzerbaijanBahamas, TheBahrainBangladeshBarbadosBelarusBelgiumBelizeBeninBermudaBhutanBoliviaBosnia and HerzegovinaBotswanaBrazilBritish Virgin IslandsBrunei DarussalamBulgariaBurkina FasoBurundiCabo VerdeCambodiaCameroonCanadaCaribbean small statesCayman IslandsCentral African RepublicCentral Europe and the BalticsChadChileChinaColombiaComorosCongo, Dem. Rep.Congo, Rep.Costa RicaCote d'IvoireCroatiaCubaCyprusCzech RepublicDenmarkDjiboutiDominicaDominican RepublicEarly-demographic dividendEast Asia & PacificEast Asia & Pacific (excluding high income)East Asia & Pacific (IDA & IBRD countries)EcuadorEgypt, Arab Rep.El SalvadorEquatorial GuineaEritreaEstoniaEthiopiaEuro areaEurope & Central AsiaEurope & Central Asia (excluding high income)Europe & Central Asia (IDA & IBRD countries)European UnionFaroe IslandsFijiFinlandFragile and conflict affected situationsFranceFrench PolynesiaGabonGambia, TheGeorgiaGermanyGhanaGibraltarGreeceGreenlandGrenadaGuamGuatemalaGuineaGuinea-BissauGuyanaHaitiHeavily indebted poor countries (HIPC)High incomeHondurasHong Kong SAR, ChinaHungaryIBRD onlyIcelandIDA & IBRD totalIDA blendIDA onlyIDA totalIndiaIndonesiaIran, Islamic Rep.IraqIrelandIsraelItalyJamaicaJapanJordanKazakhstanKenyaKiribatiKorea, Dem. People’s Rep.Korea, Rep.KuwaitKyrgyz RepublicLao PDRLate-demographic dividendLatin America & Caribbean Latin America & Caribbean (excluding high income)Latin America & the Caribbean (IDA & IBRD countries)LatviaLeast developed countries: UN classificationLebanonLesothoLiberiaLibyaLithuaniaLow & middle incomeLow incomeLower middle incomeLuxembourgMacao SAR, ChinaMacedonia, FYRMadagascarMalawiMalaysiaMaldivesMaliMaltaMarshall IslandsMauritaniaMauritiusMexicoMicronesia, Fed. Sts.Middle East & North AfricaMiddle East & North Africa (excluding high income)Middle East & North Africa (IDA & IBRD countries)Middle incomeMoldovaMongoliaMoroccoMozambiqueMyanmarNamibiaNauruNepalNetherlandsNew CaledoniaNew ZealandNicaraguaNigerNigeriaNorth AmericaNorthern Mariana IslandsNorwayOECD membersOmanOther small statesPacific island small statesPakistanPalauPanamaPapua New GuineaParaguayPeruPhilippinesPolandPortugalPost-demographic dividendPre-demographic dividendPuerto RicoQatarRomaniaRussian FederationRwandaSamoaSao Tome and PrincipeSaudi ArabiaSenegalSerbiaSeychellesSierra LeoneSingaporeSlovak RepublicSloveniaSmall statesSolomon IslandsSomaliaSouth AfricaSouth AsiaSouth Asia (IDA & IBRD)SpainSri LankaSt. Kitts and NevisSt. LuciaSt. Vincent and the GrenadinesSub-Saharan Africa Sub-Saharan Africa (excluding high income)Sub-Saharan Africa (IDA & IBRD countries)SudanSurinameSwazilandSwedenSwitzerlandSyrian Arab RepublicTajikistanTanzaniaThailandTimor-LesteTogoTongaTrinidad and TobagoTunisiaTurkeyTurkmenistanTurks and Caicos IslandsTuvaluUgandaUkraineUnited Arab EmiratesUnited KingdomUnited StatesUpper middle incomeUruguayUzbekistanVanuatuVenezuela, RBVietnamVirgin Islands (U.S.)WorldYemen, Rep.ZambiaZimbabwe Timeline:
This timeline shows a graph from 1971 to 2009 of Argentina. No data until 1970. Number of actual observations by date: 39.
Source name:
World Development Indicators
Source organization:
World Bank staff estimates from original source: European Commission, Joint Research Centre (JRC)/Netherlands Environmental Assessment Agency (PBL). Emission Database for Global Atmospheric Research (EDGAR): http://edgar.jrc.ec.europa.eu/.
Categories, topics:
Agriculture & Rural Development, Environment
Last updated:
apr 23, 2017
Indicators value changes by year
Minimum:
69.985
jan 1, 1999
Maximum:
85.358
jan 1, 1974
At the date of observation
Value
Absolute change
Change from previous value
jan 1, 1971
82.539
+82.539
0.0%
jan 1, 1972
84.259
+1.72
2.08%
jan 1, 1973
84.236
-0.023
-0.03%
jan 1, 1974
85.358
+1.121
1.33%
jan 1, 1975
84.407
-0.951
-1.11%
jan 1, 1976
84.323
-0.084
-0.1%
jan 1, 1977
83.617
-0.706
-0.84%
jan 1, 1978
84.968
+1.351
1.62%
jan 1, 1979
83.114
-1.854
-2.18%
jan 1, 1980
82.317
-0.797
-0.96%
jan 1, 1981
81.555
-0.762
-0.93%
jan 1, 1982
81.761
+0.205
0.25%
jan 1, 1983
80.72
-1.04
-1.27%
jan 1, 1984
80.177
-0.544
-0.67%
jan 1, 1985
80.282
+0.106
0.13%
jan 1, 1986
79.592
-0.69
-0.86%
jan 1, 1987
78.469
-1.123
-1.41%
jan 1, 1988
76.914
-1.555
-1.98%
jan 1, 1989
76.969
+0.055
0.07%
jan 1, 1990
76.782
-0.187
-0.24%
jan 1, 1991
76.634
-0.148
-0.19%
jan 1, 1992
76.303
-0.331
-0.43%
jan 1, 1993
75.691
-0.612
-0.8%
jan 1, 1994
74.496
-1.195
-1.58%
jan 1, 1995
74.855
+0.358
0.48%
jan 1, 1996
72.956
-1.899
-2.54%
jan 1, 1997
71.7
-1.255
-1.72%
jan 1, 1998
70.314
-1.386
-1.93%
jan 1, 1999
69.985
-0.329
-0.47%
jan 1, 2000
73.477
+3.491
4.99%
jan 1, 2001
72.209
-1.268
-1.73%
jan 1, 2002
72.349
+0.14
0.19%
jan 1, 2003
72.502
+0.153
0.21%
jan 1, 2004
71.961
-0.541
-0.75%
jan 1, 2005
71.152
-0.809
-1.12%
jan 1, 2006
71.77
+0.618
0.87%
jan 1, 2007
71.793
+0.023
0.03%
jan 1, 2008
73.533
+1.74
2.42%
jan 1, 2009
73.47
-0.063
-0.09%
Ranking of countries by current statistics by years


Comments: