29
/
en
AIzaSyAYiBZKx7MnpbEhh9jyipgxe19OcubqV5w
April 1, 2024
256041
Sweden
SWE
true
2
1
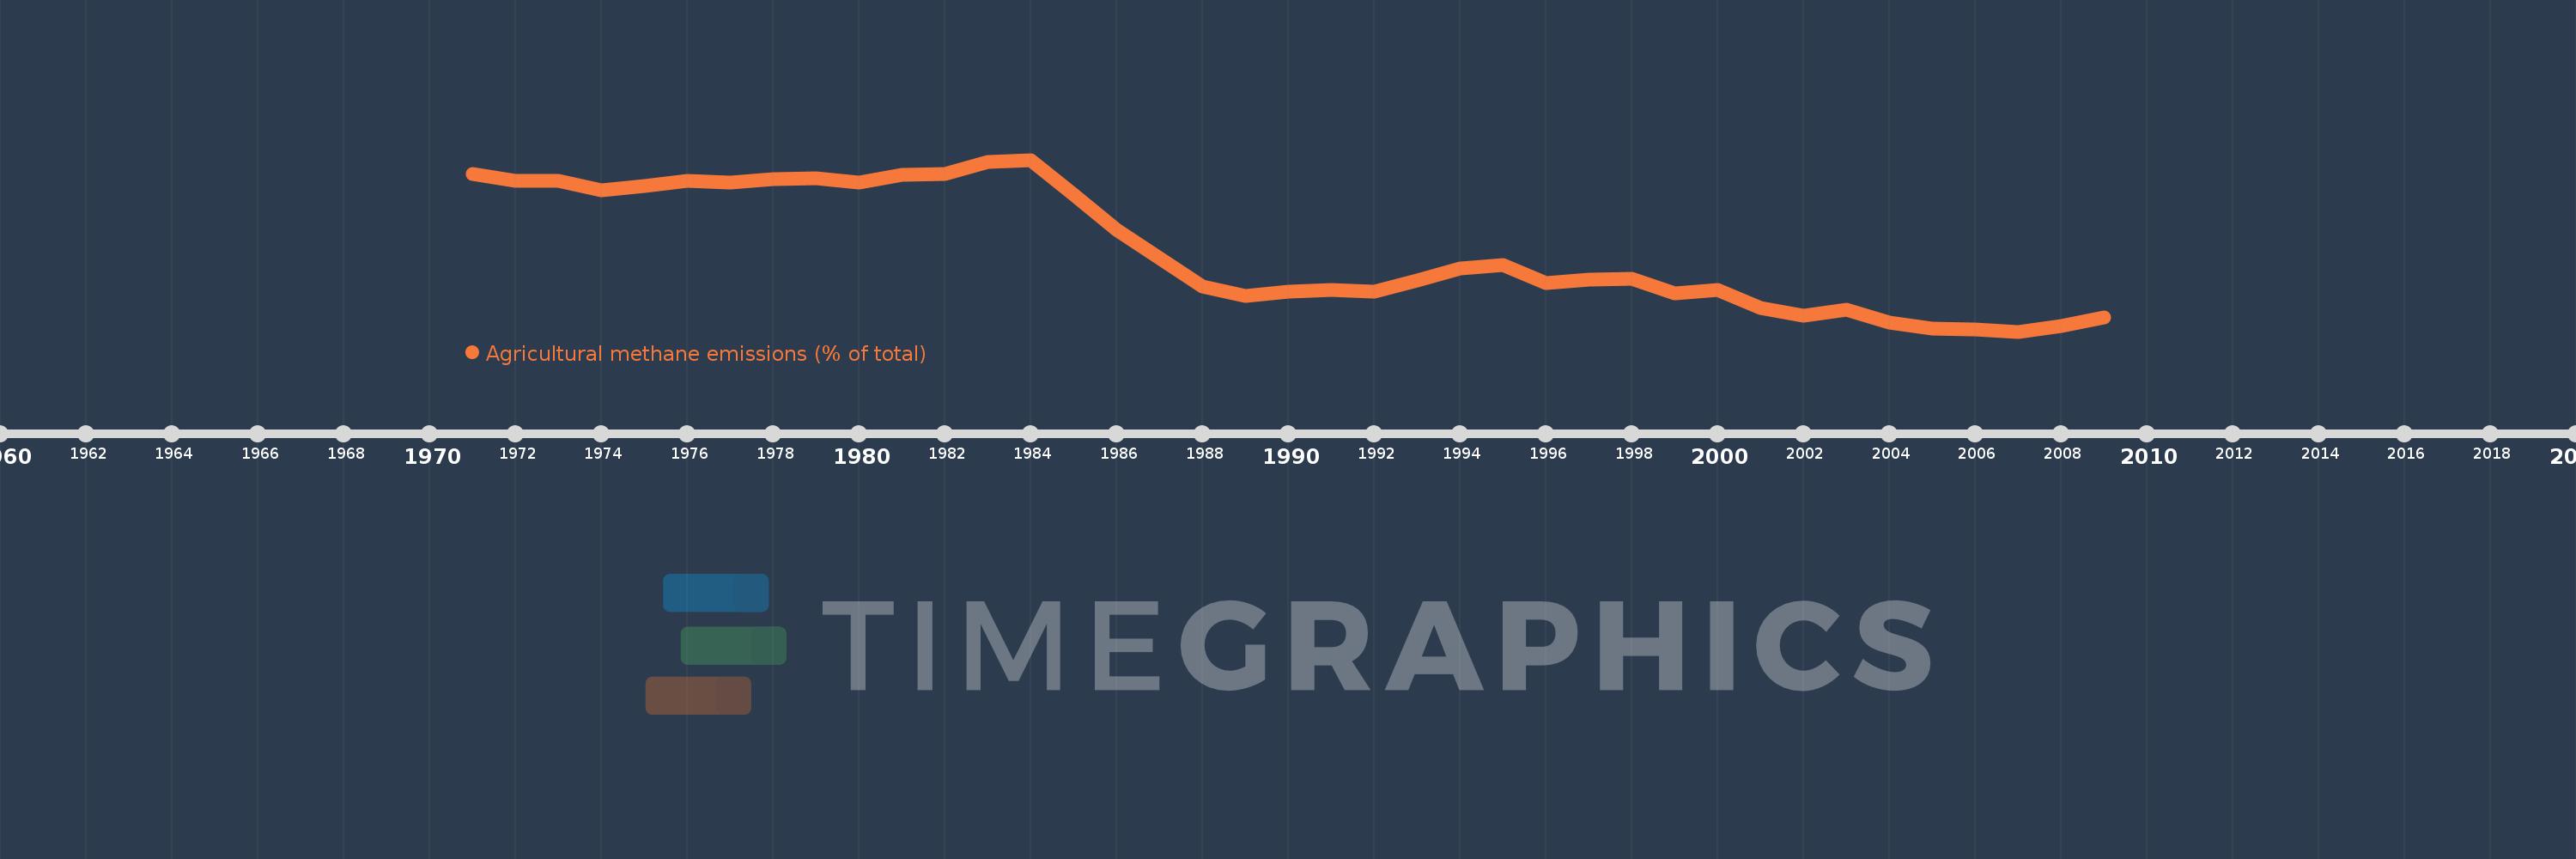
Agricultural methane emissions (% of total)
2009,2008,2007,2006,2005,2004,2003,2002,2001,2000,1999,1998,1997,1996,1995,1994,1993,1992,1991,1990,1989,1988,1987,1986,1985,1984,1983,1982,1981,1980,1979,1978,1977,1976,1975,1974,1973,1972,1971
This statistics in other country:
AfghanistanAlbaniaAlgeriaAmerican SamoaAngolaAntigua and BarbudaArab WorldArgentinaArmeniaArubaAustraliaAustriaAzerbaijanBahamas, TheBahrainBangladeshBarbadosBelarusBelgiumBelizeBeninBermudaBhutanBoliviaBosnia and HerzegovinaBotswanaBrazilBritish Virgin IslandsBrunei DarussalamBulgariaBurkina FasoBurundiCabo VerdeCambodiaCameroonCanadaCaribbean small statesCayman IslandsCentral African RepublicCentral Europe and the BalticsChadChileChinaColombiaComorosCongo, Dem. Rep.Congo, Rep.Costa RicaCote d'IvoireCroatiaCubaCyprusCzech RepublicDenmarkDjiboutiDominicaDominican RepublicEarly-demographic dividendEast Asia & PacificEast Asia & Pacific (excluding high income)East Asia & Pacific (IDA & IBRD countries)EcuadorEgypt, Arab Rep.El SalvadorEquatorial GuineaEritreaEstoniaEthiopiaEuro areaEurope & Central AsiaEurope & Central Asia (excluding high income)Europe & Central Asia (IDA & IBRD countries)European UnionFaroe IslandsFijiFinlandFragile and conflict affected situationsFranceFrench PolynesiaGabonGambia, TheGeorgiaGermanyGhanaGibraltarGreeceGreenlandGrenadaGuamGuatemalaGuineaGuinea-BissauGuyanaHaitiHeavily indebted poor countries (HIPC)High incomeHondurasHong Kong SAR, ChinaHungaryIBRD onlyIcelandIDA & IBRD totalIDA blendIDA onlyIDA totalIndiaIndonesiaIran, Islamic Rep.IraqIrelandIsraelItalyJamaicaJapanJordanKazakhstanKenyaKiribatiKorea, Dem. People’s Rep.Korea, Rep.KuwaitKyrgyz RepublicLao PDRLate-demographic dividendLatin America & Caribbean Latin America & Caribbean (excluding high income)Latin America & the Caribbean (IDA & IBRD countries)LatviaLeast developed countries: UN classificationLebanonLesothoLiberiaLibyaLithuaniaLow & middle incomeLow incomeLower middle incomeLuxembourgMacao SAR, ChinaMacedonia, FYRMadagascarMalawiMalaysiaMaldivesMaliMaltaMarshall IslandsMauritaniaMauritiusMexicoMicronesia, Fed. Sts.Middle East & North AfricaMiddle East & North Africa (excluding high income)Middle East & North Africa (IDA & IBRD countries)Middle incomeMoldovaMongoliaMoroccoMozambiqueMyanmarNamibiaNauruNepalNetherlandsNew CaledoniaNew ZealandNicaraguaNigerNigeriaNorth AmericaNorthern Mariana IslandsNorwayOECD membersOmanOther small statesPacific island small statesPakistanPalauPanamaPapua New GuineaParaguayPeruPhilippinesPolandPortugalPost-demographic dividendPre-demographic dividendPuerto RicoQatarRomaniaRussian FederationRwandaSamoaSao Tome and PrincipeSaudi ArabiaSenegalSerbiaSeychellesSierra LeoneSingaporeSlovak RepublicSloveniaSmall statesSolomon IslandsSomaliaSouth AfricaSouth AsiaSouth Asia (IDA & IBRD)SpainSri LankaSt. Kitts and NevisSt. LuciaSt. Vincent and the GrenadinesSub-Saharan Africa Sub-Saharan Africa (excluding high income)Sub-Saharan Africa (IDA & IBRD countries)SudanSurinameSwazilandSwedenSwitzerlandSyrian Arab RepublicTajikistanTanzaniaThailandTimor-LesteTogoTongaTrinidad and TobagoTunisiaTurkeyTurkmenistanTurks and Caicos IslandsTuvaluUgandaUkraineUnited Arab EmiratesUnited KingdomUnited StatesUpper middle incomeUruguayUzbekistanVanuatuVenezuela, RBVietnamVirgin Islands (U.S.)WorldYemen, Rep.ZambiaZimbabwe Timeline:
This timeline shows a graph from 1971 to 2009 of Sweden. No data until 1970. Number of actual observations by date: 39.
Source name:
World Development Indicators
Source organization:
World Bank staff estimates from original source: European Commission, Joint Research Centre (JRC)/Netherlands Environmental Assessment Agency (PBL). Emission Database for Global Atmospheric Research (EDGAR): http://edgar.jrc.ec.europa.eu/.
Categories, topics:
Agriculture & Rural Development, Environment
Last updated:
apr 23, 2017
Indicators value changes by year
Minimum:
27.492
jan 1, 2007
Maximum:
35.911
jan 1, 1984
At the date of observation
Value
Absolute change
Change from previous value
jan 1, 1971
35.226
+35.226
0.0%
jan 1, 1972
34.877
-0.349
-0.99%
jan 1, 1973
34.86
-0.017
-0.05%
jan 1, 1974
34.42
-0.44
-1.26%
jan 1, 1975
34.625
+0.205
0.59%
jan 1, 1976
34.859
+0.235
0.68%
jan 1, 1977
34.793
-0.066
-0.19%
jan 1, 1978
34.966
+0.172
0.5%
jan 1, 1979
35.012
+0.047
0.13%
jan 1, 1980
34.804
-0.208
-0.59%
jan 1, 1981
35.183
+0.379
1.09%
jan 1, 1982
35.205
+0.021
0.06%
jan 1, 1983
35.785
+0.581
1.65%
jan 1, 1984
35.911
+0.126
0.35%
jan 1, 1985
34.199
-1.712
-4.77%
jan 1, 1986
32.48
-1.719
-5.03%
jan 1, 1987
31.096
-1.383
-4.26%
jan 1, 1988
29.689
-1.408
-4.53%
jan 1, 1989
29.246
-0.443
-1.49%
jan 1, 1990
29.454
+0.209
0.71%
jan 1, 1991
29.554
+0.1
0.34%
jan 1, 1992
29.463
-0.091
-0.31%
jan 1, 1993
30.002
+0.539
1.83%
jan 1, 1994
30.565
+0.563
1.88%
jan 1, 1995
30.752
+0.187
0.61%
jan 1, 1996
29.879
-0.873
-2.84%
jan 1, 1997
30.059
+0.18
0.6%
jan 1, 1998
30.069
+0.01
0.03%
jan 1, 1999
29.365
-0.704
-2.34%
jan 1, 2000
29.526
+0.161
0.55%
jan 1, 2001
28.648
-0.878
-2.97%
jan 1, 2002
28.28
-0.367
-1.28%
jan 1, 2003
28.57
+0.289
1.02%
jan 1, 2004
27.923
-0.647
-2.26%
jan 1, 2005
27.619
-0.304
-1.09%
jan 1, 2006
27.613
-0.006
-0.02%
jan 1, 2007
27.492
-0.121
-0.44%
jan 1, 2008
27.762
+0.27
0.98%
jan 1, 2009
28.204
+0.441
1.59%
Ranking of countries by current statistics by years


Comments: