29
/
en
AIzaSyAYiBZKx7MnpbEhh9jyipgxe19OcubqV5w
April 1, 2024
129058
Estonia
EST
true
2
1
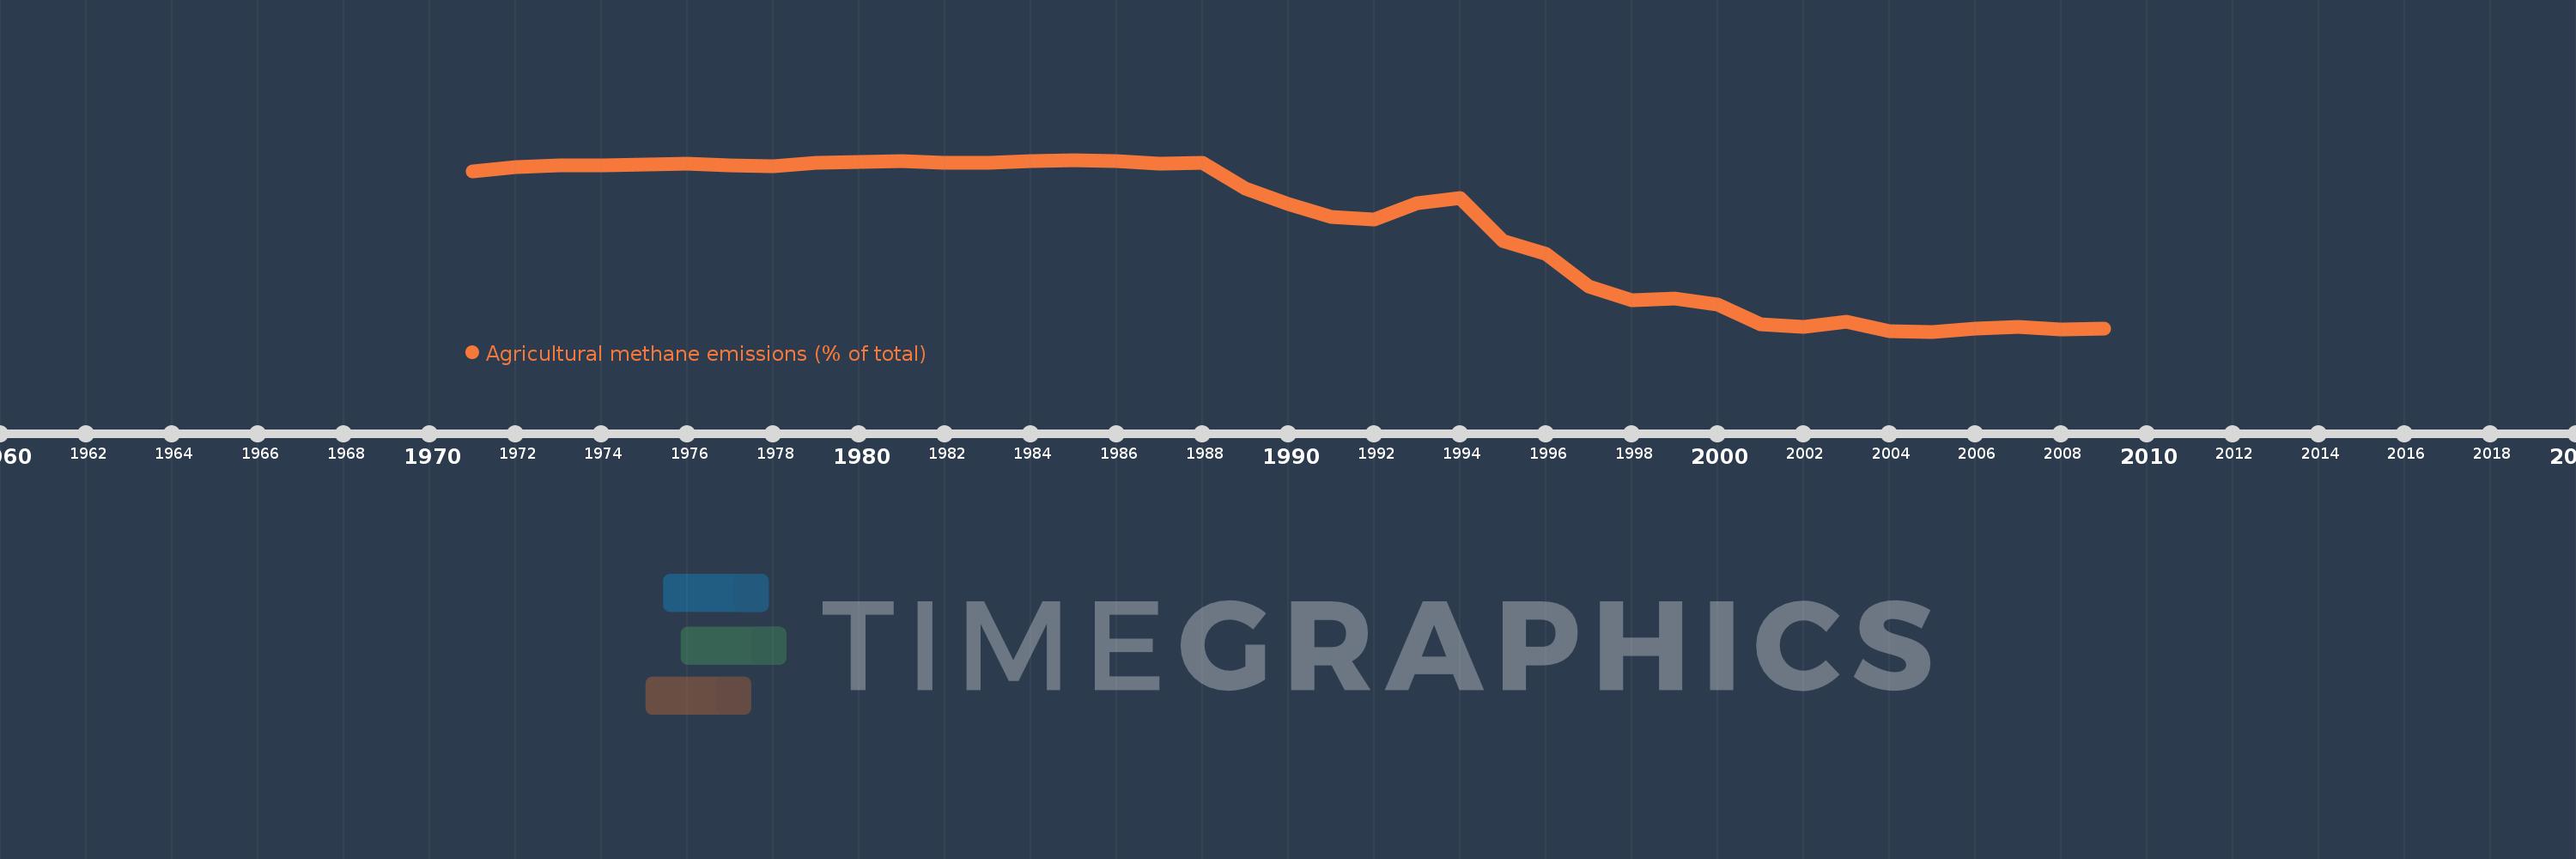
Agricultural methane emissions (% of total)
2009,2008,2007,2006,2005,2004,2003,2002,2001,2000,1999,1998,1997,1996,1995,1994,1993,1992,1991,1990,1989,1988,1987,1986,1985,1984,1983,1982,1981,1980,1979,1978,1977,1976,1975,1974,1973,1972,1971
This statistics in other country:
AfghanistanAlbaniaAlgeriaAmerican SamoaAngolaAntigua and BarbudaArab WorldArgentinaArmeniaArubaAustraliaAustriaAzerbaijanBahamas, TheBahrainBangladeshBarbadosBelarusBelgiumBelizeBeninBermudaBhutanBoliviaBosnia and HerzegovinaBotswanaBrazilBritish Virgin IslandsBrunei DarussalamBulgariaBurkina FasoBurundiCabo VerdeCambodiaCameroonCanadaCaribbean small statesCayman IslandsCentral African RepublicCentral Europe and the BalticsChadChileChinaColombiaComorosCongo, Dem. Rep.Congo, Rep.Costa RicaCote d'IvoireCroatiaCubaCyprusCzech RepublicDenmarkDjiboutiDominicaDominican RepublicEarly-demographic dividendEast Asia & PacificEast Asia & Pacific (excluding high income)East Asia & Pacific (IDA & IBRD countries)EcuadorEgypt, Arab Rep.El SalvadorEquatorial GuineaEritreaEstoniaEthiopiaEuro areaEurope & Central AsiaEurope & Central Asia (excluding high income)Europe & Central Asia (IDA & IBRD countries)European UnionFaroe IslandsFijiFinlandFragile and conflict affected situationsFranceFrench PolynesiaGabonGambia, TheGeorgiaGermanyGhanaGibraltarGreeceGreenlandGrenadaGuamGuatemalaGuineaGuinea-BissauGuyanaHaitiHeavily indebted poor countries (HIPC)High incomeHondurasHong Kong SAR, ChinaHungaryIBRD onlyIcelandIDA & IBRD totalIDA blendIDA onlyIDA totalIndiaIndonesiaIran, Islamic Rep.IraqIrelandIsraelItalyJamaicaJapanJordanKazakhstanKenyaKiribatiKorea, Dem. People’s Rep.Korea, Rep.KuwaitKyrgyz RepublicLao PDRLate-demographic dividendLatin America & Caribbean Latin America & Caribbean (excluding high income)Latin America & the Caribbean (IDA & IBRD countries)LatviaLeast developed countries: UN classificationLebanonLesothoLiberiaLibyaLithuaniaLow & middle incomeLow incomeLower middle incomeLuxembourgMacao SAR, ChinaMacedonia, FYRMadagascarMalawiMalaysiaMaldivesMaliMaltaMarshall IslandsMauritaniaMauritiusMexicoMicronesia, Fed. Sts.Middle East & North AfricaMiddle East & North Africa (excluding high income)Middle East & North Africa (IDA & IBRD countries)Middle incomeMoldovaMongoliaMoroccoMozambiqueMyanmarNamibiaNauruNepalNetherlandsNew CaledoniaNew ZealandNicaraguaNigerNigeriaNorth AmericaNorthern Mariana IslandsNorwayOECD membersOmanOther small statesPacific island small statesPakistanPalauPanamaPapua New GuineaParaguayPeruPhilippinesPolandPortugalPost-demographic dividendPre-demographic dividendPuerto RicoQatarRomaniaRussian FederationRwandaSamoaSao Tome and PrincipeSaudi ArabiaSenegalSerbiaSeychellesSierra LeoneSingaporeSlovak RepublicSloveniaSmall statesSolomon IslandsSomaliaSouth AfricaSouth AsiaSouth Asia (IDA & IBRD)SpainSri LankaSt. Kitts and NevisSt. LuciaSt. Vincent and the GrenadinesSub-Saharan Africa Sub-Saharan Africa (excluding high income)Sub-Saharan Africa (IDA & IBRD countries)SudanSurinameSwazilandSwedenSwitzerlandSyrian Arab RepublicTajikistanTanzaniaThailandTimor-LesteTogoTongaTrinidad and TobagoTunisiaTurkeyTurkmenistanTurks and Caicos IslandsTuvaluUgandaUkraineUnited Arab EmiratesUnited KingdomUnited StatesUpper middle incomeUruguayUzbekistanVanuatuVenezuela, RBVietnamVirgin Islands (U.S.)WorldYemen, Rep.ZambiaZimbabwe Timeline:
This timeline shows a graph from 1971 to 2009 of Estonia. No data until 1970. Number of actual observations by date: 39.
Source name:
World Development Indicators
Source organization:
World Bank staff estimates from original source: European Commission, Joint Research Centre (JRC)/Netherlands Environmental Assessment Agency (PBL). Emission Database for Global Atmospheric Research (EDGAR): http://edgar.jrc.ec.europa.eu/.
Categories, topics:
Agriculture & Rural Development, Environment
Last updated:
apr 23, 2017
Indicators value changes by year
Minimum:
28.518
jan 1, 2005
Maximum:
59.912
jan 1, 1985
At the date of observation
Value
Absolute change
Change from previous value
jan 1, 1971
57.807
+57.807
0.0%
jan 1, 1972
58.598
+0.792
1.37%
jan 1, 1973
58.95
+0.352
0.6%
jan 1, 1974
58.938
-0.012
-0.02%
jan 1, 1975
59.027
+0.089
0.15%
jan 1, 1976
59.246
+0.219
0.37%
jan 1, 1977
58.922
-0.324
-0.55%
jan 1, 1978
58.724
-0.198
-0.34%
jan 1, 1979
59.343
+0.619
1.05%
jan 1, 1980
59.56
+0.217
0.37%
jan 1, 1981
59.62
+0.06
0.1%
jan 1, 1982
59.384
-0.236
-0.4%
jan 1, 1983
59.336
-0.048
-0.08%
jan 1, 1984
59.619
+0.283
0.48%
jan 1, 1985
59.912
+0.293
0.49%
jan 1, 1986
59.725
-0.187
-0.31%
jan 1, 1987
59.217
-0.508
-0.85%
jan 1, 1988
59.3
+0.083
0.14%
jan 1, 1989
54.611
-4.69
-7.91%
jan 1, 1990
51.85
-2.761
-5.06%
jan 1, 1991
49.456
-2.394
-4.62%
jan 1, 1992
49.048
-0.408
-0.82%
jan 1, 1993
52.008
+2.959
6.03%
jan 1, 1994
52.914
+0.907
1.74%
jan 1, 1995
45.019
-7.895
-14.92%
jan 1, 1996
42.798
-2.221
-4.93%
jan 1, 1997
36.688
-6.111
-14.28%
jan 1, 1998
34.219
-2.469
-6.73%
jan 1, 1999
34.564
+0.345
1.01%
jan 1, 2000
33.527
-1.036
-3.0%
jan 1, 2001
29.864
-3.663
-10.92%
jan 1, 2002
29.386
-0.478
-1.6%
jan 1, 2003
30.376
+0.99
3.37%
jan 1, 2004
28.579
-1.796
-5.91%
jan 1, 2005
28.518
-0.061
-0.21%
jan 1, 2006
29.065
+0.547
1.92%
jan 1, 2007
29.389
+0.324
1.11%
jan 1, 2008
28.859
-0.53
-1.8%
jan 1, 2009
29.047
+0.188
0.65%
Ranking of countries by current statistics by years


Comments: