29
/
en
AIzaSyAYiBZKx7MnpbEhh9jyipgxe19OcubqV5w
April 1, 2024
192709
Mauritania
MRT
true
2
1
Agricultural methane emissions (% of total)
2009,2008,2007,2006,2005,2004,2003,2002,2001,2000,1999,1998,1997,1996,1995,1994,1993,1992,1991,1990,1989,1988,1987,1986,1985,1984,1983,1982,1981,1980,1979,1978,1977,1976,1975,1974,1973,1972,1971
This statistics in other country:
AfghanistanAlbaniaAlgeriaAmerican SamoaAngolaAntigua and BarbudaArab WorldArgentinaArmeniaArubaAustraliaAustriaAzerbaijanBahamas, TheBahrainBangladeshBarbadosBelarusBelgiumBelizeBeninBermudaBhutanBoliviaBosnia and HerzegovinaBotswanaBrazilBritish Virgin IslandsBrunei DarussalamBulgariaBurkina FasoBurundiCabo VerdeCambodiaCameroonCanadaCaribbean small statesCayman IslandsCentral African RepublicCentral Europe and the BalticsChadChileChinaColombiaComorosCongo, Dem. Rep.Congo, Rep.Costa RicaCote d'IvoireCroatiaCubaCyprusCzech RepublicDenmarkDjiboutiDominicaDominican RepublicEarly-demographic dividendEast Asia & PacificEast Asia & Pacific (excluding high income)East Asia & Pacific (IDA & IBRD countries)EcuadorEgypt, Arab Rep.El SalvadorEquatorial GuineaEritreaEstoniaEthiopiaEuro areaEurope & Central AsiaEurope & Central Asia (excluding high income)Europe & Central Asia (IDA & IBRD countries)European UnionFaroe IslandsFijiFinlandFragile and conflict affected situationsFranceFrench PolynesiaGabonGambia, TheGeorgiaGermanyGhanaGibraltarGreeceGreenlandGrenadaGuamGuatemalaGuineaGuinea-BissauGuyanaHaitiHeavily indebted poor countries (HIPC)High incomeHondurasHong Kong SAR, ChinaHungaryIBRD onlyIcelandIDA & IBRD totalIDA blendIDA onlyIDA totalIndiaIndonesiaIran, Islamic Rep.IraqIrelandIsraelItalyJamaicaJapanJordanKazakhstanKenyaKiribatiKorea, Dem. People’s Rep.Korea, Rep.KuwaitKyrgyz RepublicLao PDRLate-demographic dividendLatin America & Caribbean Latin America & Caribbean (excluding high income)Latin America & the Caribbean (IDA & IBRD countries)LatviaLeast developed countries: UN classificationLebanonLesothoLiberiaLibyaLithuaniaLow & middle incomeLow incomeLower middle incomeLuxembourgMacao SAR, ChinaMacedonia, FYRMadagascarMalawiMalaysiaMaldivesMaliMaltaMarshall IslandsMauritaniaMauritiusMexicoMicronesia, Fed. Sts.Middle East & North AfricaMiddle East & North Africa (excluding high income)Middle East & North Africa (IDA & IBRD countries)Middle incomeMoldovaMongoliaMoroccoMozambiqueMyanmarNamibiaNauruNepalNetherlandsNew CaledoniaNew ZealandNicaraguaNigerNigeriaNorth AmericaNorthern Mariana IslandsNorwayOECD membersOmanOther small statesPacific island small statesPakistanPalauPanamaPapua New GuineaParaguayPeruPhilippinesPolandPortugalPost-demographic dividendPre-demographic dividendPuerto RicoQatarRomaniaRussian FederationRwandaSamoaSao Tome and PrincipeSaudi ArabiaSenegalSerbiaSeychellesSierra LeoneSingaporeSlovak RepublicSloveniaSmall statesSolomon IslandsSomaliaSouth AfricaSouth AsiaSouth Asia (IDA & IBRD)SpainSri LankaSt. Kitts and NevisSt. LuciaSt. Vincent and the GrenadinesSub-Saharan Africa Sub-Saharan Africa (excluding high income)Sub-Saharan Africa (IDA & IBRD countries)SudanSurinameSwazilandSwedenSwitzerlandSyrian Arab RepublicTajikistanTanzaniaThailandTimor-LesteTogoTongaTrinidad and TobagoTunisiaTurkeyTurkmenistanTurks and Caicos IslandsTuvaluUgandaUkraineUnited Arab EmiratesUnited KingdomUnited StatesUpper middle incomeUruguayUzbekistanVanuatuVenezuela, RBVietnamVirgin Islands (U.S.)WorldYemen, Rep.ZambiaZimbabwe Timeline:
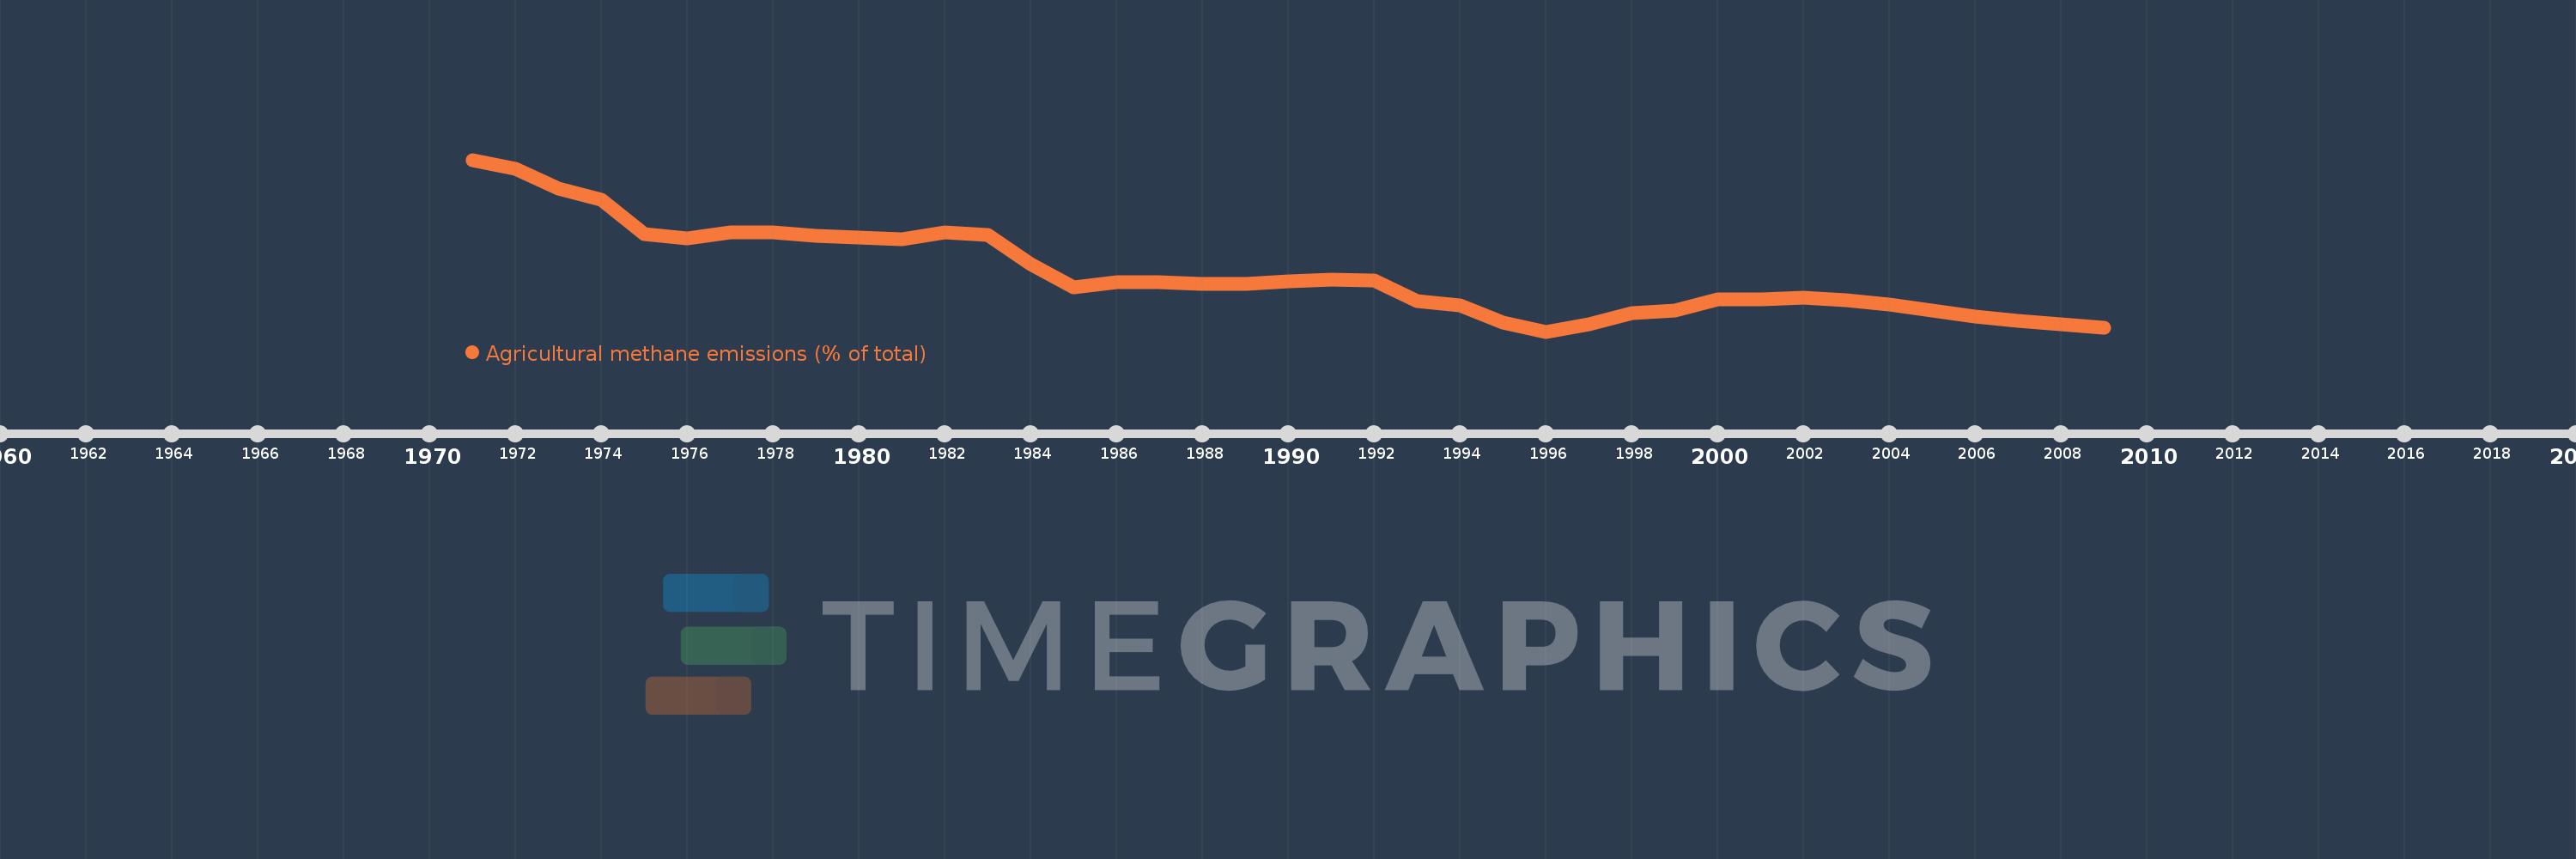
This timeline shows a graph from 1971 to 2009 of Mauritania. No data until 1970. Number of actual observations by date: 39.
Source name:
World Development Indicators
Source organization:
World Bank staff estimates from original source: European Commission, Joint Research Centre (JRC)/Netherlands Environmental Assessment Agency (PBL). Emission Database for Global Atmospheric Research (EDGAR): http://edgar.jrc.ec.europa.eu/.
Categories, topics:
Agriculture & Rural Development, Environment
Last updated:
apr 23, 2017
Indicators value changes by year
Minimum:
82.939
jan 1, 1996
Maximum:
91.856
jan 1, 1971
At the date of observation
Value
Absolute change
Change from previous value
jan 1, 1971
91.856
+91.856
0.0%
jan 1, 1972
91.398
-0.458
-0.5%
jan 1, 1973
90.384
-1.014
-1.11%
jan 1, 1974
89.798
-0.586
-0.65%
jan 1, 1975
87.997
-1.801
-2.01%
jan 1, 1976
87.777
-0.22
-0.25%
jan 1, 1977
88.081
+0.304
0.35%
jan 1, 1978
88.11
+0.029
0.03%
jan 1, 1979
87.891
-0.219
-0.25%
jan 1, 1980
87.82
-0.072
-0.08%
jan 1, 1981
87.735
-0.085
-0.1%
jan 1, 1982
88.107
+0.373
0.42%
jan 1, 1983
87.975
-0.133
-0.15%
jan 1, 1984
86.419
-1.555
-1.77%
jan 1, 1985
85.245
-1.175
-1.36%
jan 1, 1986
85.511
+0.267
0.31%
jan 1, 1987
85.507
-0.005
-0.01%
jan 1, 1988
85.431
-0.076
-0.09%
jan 1, 1989
85.403
-0.028
-0.03%
jan 1, 1990
85.561
+0.158
0.19%
jan 1, 1991
85.656
+0.095
0.11%
jan 1, 1992
85.571
-0.085
-0.1%
jan 1, 1993
84.506
-1.065
-1.24%
jan 1, 1994
84.317
-0.189
-0.22%
jan 1, 1995
83.39
-0.928
-1.1%
jan 1, 1996
82.939
-0.45
-0.54%
jan 1, 1997
83.332
+0.393
0.47%
jan 1, 1998
83.887
+0.554
0.67%
jan 1, 1999
84.031
+0.144
0.17%
jan 1, 2000
84.619
+0.588
0.7%
jan 1, 2001
84.601
-0.018
-0.02%
jan 1, 2002
84.707
+0.106
0.13%
jan 1, 2003
84.585
-0.121
-0.14%
jan 1, 2004
84.362
-0.223
-0.26%
jan 1, 2005
84.037
-0.325
-0.39%
jan 1, 2006
83.727
-0.31
-0.37%
jan 1, 2007
83.484
-0.243
-0.29%
jan 1, 2008
83.331
-0.153
-0.18%
jan 1, 2009
83.118
-0.213
-0.26%
Ranking of countries by current statistics by years


Comments: