29
/
en
AIzaSyAYiBZKx7MnpbEhh9jyipgxe19OcubqV5w
April 1, 2024
169157
Korea, Dem. People’s Rep.
PRK
true
2
1
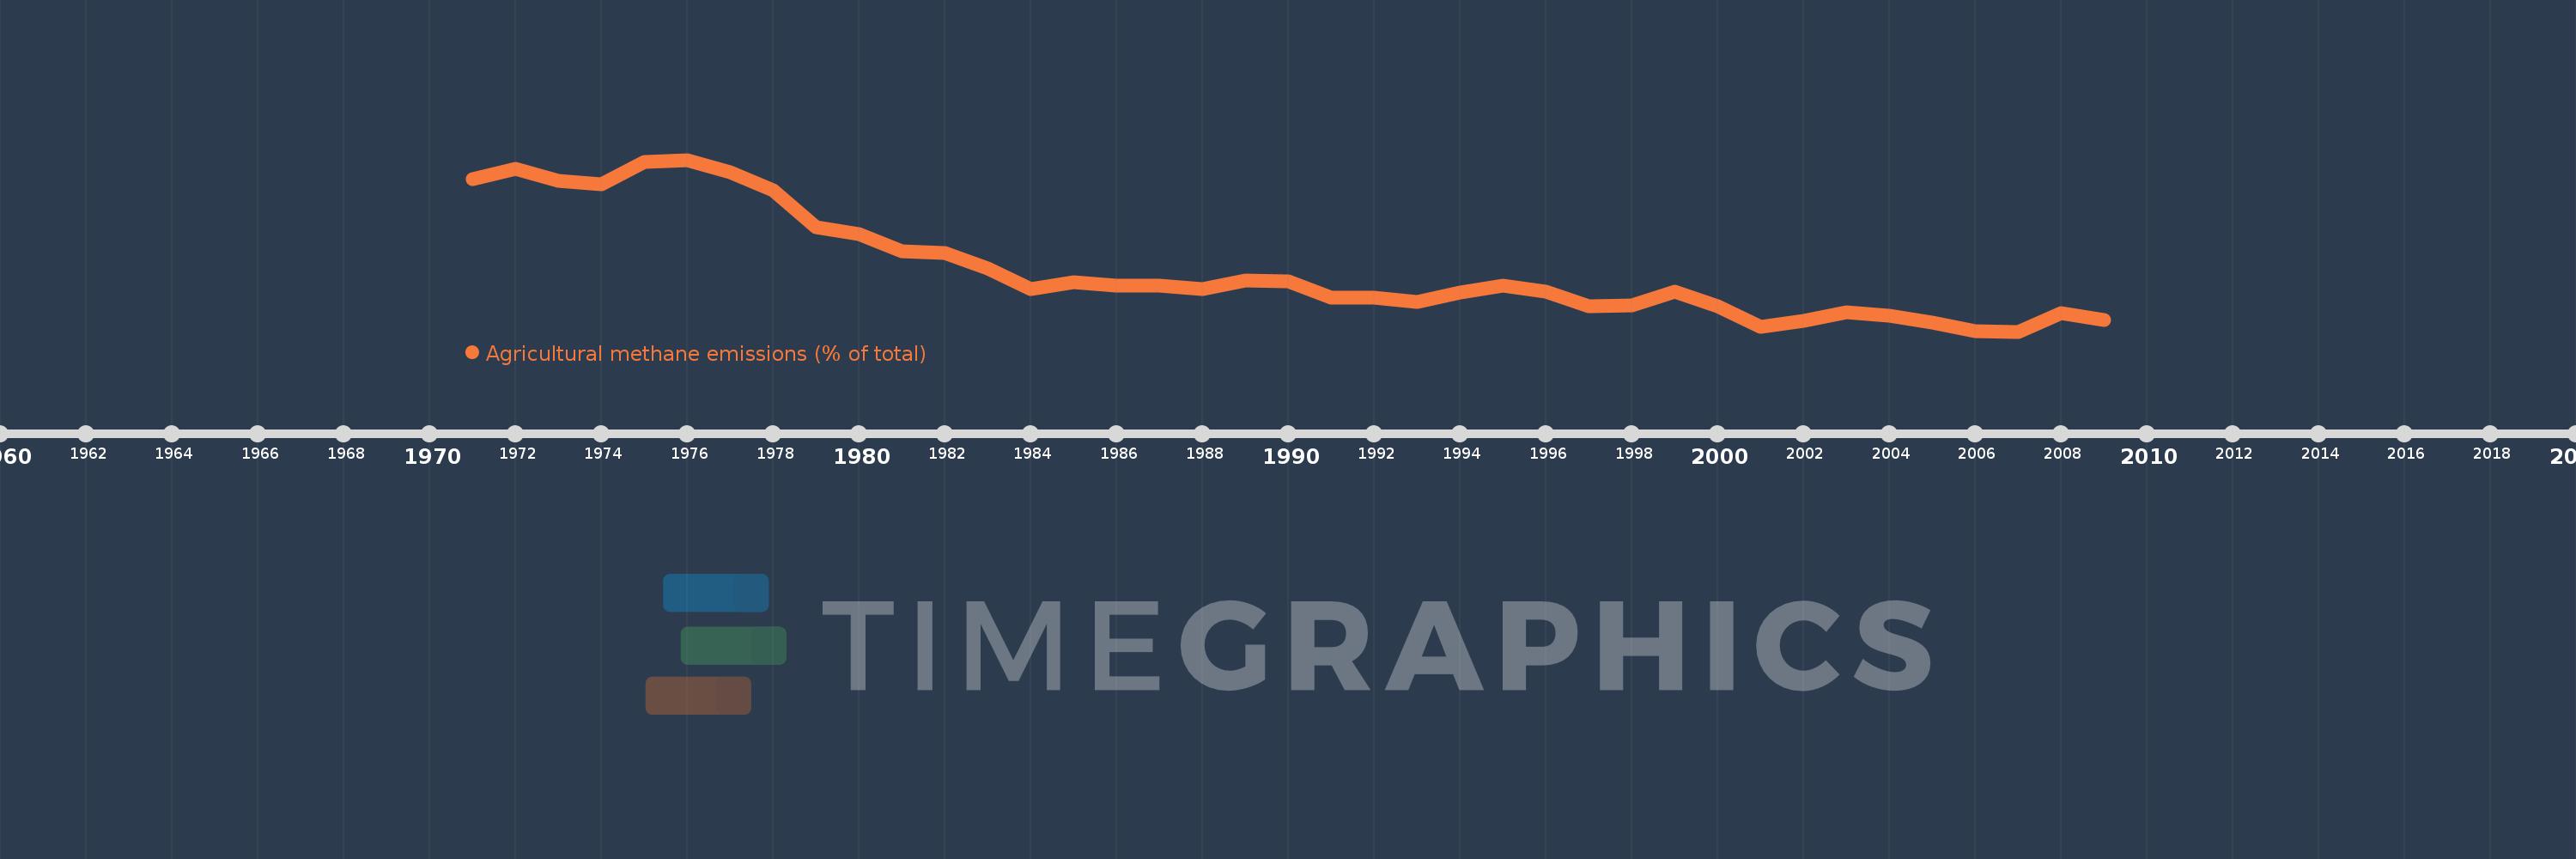
Agricultural methane emissions (% of total)
2009,2008,2007,2006,2005,2004,2003,2002,2001,2000,1999,1998,1997,1996,1995,1994,1993,1992,1991,1990,1989,1988,1987,1986,1985,1984,1983,1982,1981,1980,1979,1978,1977,1976,1975,1974,1973,1972,1971
This statistics in other country:
AfghanistanAlbaniaAlgeriaAmerican SamoaAngolaAntigua and BarbudaArab WorldArgentinaArmeniaArubaAustraliaAustriaAzerbaijanBahamas, TheBahrainBangladeshBarbadosBelarusBelgiumBelizeBeninBermudaBhutanBoliviaBosnia and HerzegovinaBotswanaBrazilBritish Virgin IslandsBrunei DarussalamBulgariaBurkina FasoBurundiCabo VerdeCambodiaCameroonCanadaCaribbean small statesCayman IslandsCentral African RepublicCentral Europe and the BalticsChadChileChinaColombiaComorosCongo, Dem. Rep.Congo, Rep.Costa RicaCote d'IvoireCroatiaCubaCyprusCzech RepublicDenmarkDjiboutiDominicaDominican RepublicEarly-demographic dividendEast Asia & PacificEast Asia & Pacific (excluding high income)East Asia & Pacific (IDA & IBRD countries)EcuadorEgypt, Arab Rep.El SalvadorEquatorial GuineaEritreaEstoniaEthiopiaEuro areaEurope & Central AsiaEurope & Central Asia (excluding high income)Europe & Central Asia (IDA & IBRD countries)European UnionFaroe IslandsFijiFinlandFragile and conflict affected situationsFranceFrench PolynesiaGabonGambia, TheGeorgiaGermanyGhanaGibraltarGreeceGreenlandGrenadaGuamGuatemalaGuineaGuinea-BissauGuyanaHaitiHeavily indebted poor countries (HIPC)High incomeHondurasHong Kong SAR, ChinaHungaryIBRD onlyIcelandIDA & IBRD totalIDA blendIDA onlyIDA totalIndiaIndonesiaIran, Islamic Rep.IraqIrelandIsraelItalyJamaicaJapanJordanKazakhstanKenyaKiribatiKorea, Dem. People’s Rep.Korea, Rep.KuwaitKyrgyz RepublicLao PDRLate-demographic dividendLatin America & Caribbean Latin America & Caribbean (excluding high income)Latin America & the Caribbean (IDA & IBRD countries)LatviaLeast developed countries: UN classificationLebanonLesothoLiberiaLibyaLithuaniaLow & middle incomeLow incomeLower middle incomeLuxembourgMacao SAR, ChinaMacedonia, FYRMadagascarMalawiMalaysiaMaldivesMaliMaltaMarshall IslandsMauritaniaMauritiusMexicoMicronesia, Fed. Sts.Middle East & North AfricaMiddle East & North Africa (excluding high income)Middle East & North Africa (IDA & IBRD countries)Middle incomeMoldovaMongoliaMoroccoMozambiqueMyanmarNamibiaNauruNepalNetherlandsNew CaledoniaNew ZealandNicaraguaNigerNigeriaNorth AmericaNorthern Mariana IslandsNorwayOECD membersOmanOther small statesPacific island small statesPakistanPalauPanamaPapua New GuineaParaguayPeruPhilippinesPolandPortugalPost-demographic dividendPre-demographic dividendPuerto RicoQatarRomaniaRussian FederationRwandaSamoaSao Tome and PrincipeSaudi ArabiaSenegalSerbiaSeychellesSierra LeoneSingaporeSlovak RepublicSloveniaSmall statesSolomon IslandsSomaliaSouth AfricaSouth AsiaSouth Asia (IDA & IBRD)SpainSri LankaSt. Kitts and NevisSt. LuciaSt. Vincent and the GrenadinesSub-Saharan Africa Sub-Saharan Africa (excluding high income)Sub-Saharan Africa (IDA & IBRD countries)SudanSurinameSwazilandSwedenSwitzerlandSyrian Arab RepublicTajikistanTanzaniaThailandTimor-LesteTogoTongaTrinidad and TobagoTunisiaTurkeyTurkmenistanTurks and Caicos IslandsTuvaluUgandaUkraineUnited Arab EmiratesUnited KingdomUnited StatesUpper middle incomeUruguayUzbekistanVanuatuVenezuela, RBVietnamVirgin Islands (U.S.)WorldYemen, Rep.ZambiaZimbabwe Timeline:
This timeline shows a graph from 1971 to 2009 of Korea, Dem. People’s Rep.. No data until 1970. Number of actual observations by date: 39.
Source name:
World Development Indicators
Source organization:
World Bank staff estimates from original source: European Commission, Joint Research Centre (JRC)/Netherlands Environmental Assessment Agency (PBL). Emission Database for Global Atmospheric Research (EDGAR): http://edgar.jrc.ec.europa.eu/.
Categories, topics:
Agriculture & Rural Development, Environment
Last updated:
apr 23, 2017
Indicators value changes by year
Minimum:
22.115
jan 1, 2007
At the date of observation
Value
Absolute change
Change from previous value
jan 1, 1971
38.206
+38.206
0.0%
jan 1, 1972
39.258
+1.052
2.75%
jan 1, 1973
38.02
-1.238
-3.15%
jan 1, 1974
37.638
-0.382
-1.0%
jan 1, 1975
40.012
+2.374
6.31%
jan 1, 1976
40.24
+0.229
0.57%
jan 1, 1977
38.914
-1.326
-3.3%
jan 1, 1978
37.023
-1.891
-4.86%
jan 1, 1979
33.113
-3.91
-10.56%
jan 1, 1980
32.423
-0.69
-2.08%
jan 1, 1981
30.593
-1.83
-5.64%
jan 1, 1982
30.388
-0.205
-0.67%
jan 1, 1983
28.785
-1.603
-5.28%
jan 1, 1984
26.592
-2.193
-7.62%
jan 1, 1985
27.341
+0.749
2.82%
jan 1, 1986
26.982
-0.359
-1.31%
jan 1, 1987
26.94
-0.042
-0.16%
jan 1, 1988
26.58
-0.36
-1.34%
jan 1, 1989
27.509
+0.929
3.49%
jan 1, 1990
27.373
-0.136
-0.5%
jan 1, 1991
25.678
-1.695
-6.19%
jan 1, 1992
25.695
+0.017
0.06%
jan 1, 1993
25.226
-0.469
-1.82%
jan 1, 1994
26.225
+0.998
3.96%
jan 1, 1995
26.938
+0.713
2.72%
jan 1, 1996
26.349
-0.589
-2.19%
jan 1, 1997
24.76
-1.589
-6.03%
jan 1, 1998
24.91
+0.151
0.61%
jan 1, 1999
26.335
+1.425
5.72%
jan 1, 2000
24.832
-1.503
-5.71%
jan 1, 2001
22.657
-2.175
-8.76%
jan 1, 2002
23.278
+0.621
2.74%
jan 1, 2003
24.161
+0.883
3.79%
jan 1, 2004
23.784
-0.377
-1.56%
jan 1, 2005
23.031
-0.753
-3.16%
jan 1, 2006
22.168
-0.864
-3.75%
jan 1, 2007
22.115
-0.052
-0.24%
jan 1, 2008
24.058
+1.943
8.79%
jan 1, 2009
23.301
-0.757
-3.15%
Ranking of countries by current statistics by years


Comments: