29
/
en
AIzaSyAYiBZKx7MnpbEhh9jyipgxe19OcubqV5w
April 1, 2024
224542
Poland
POL
true
2
1
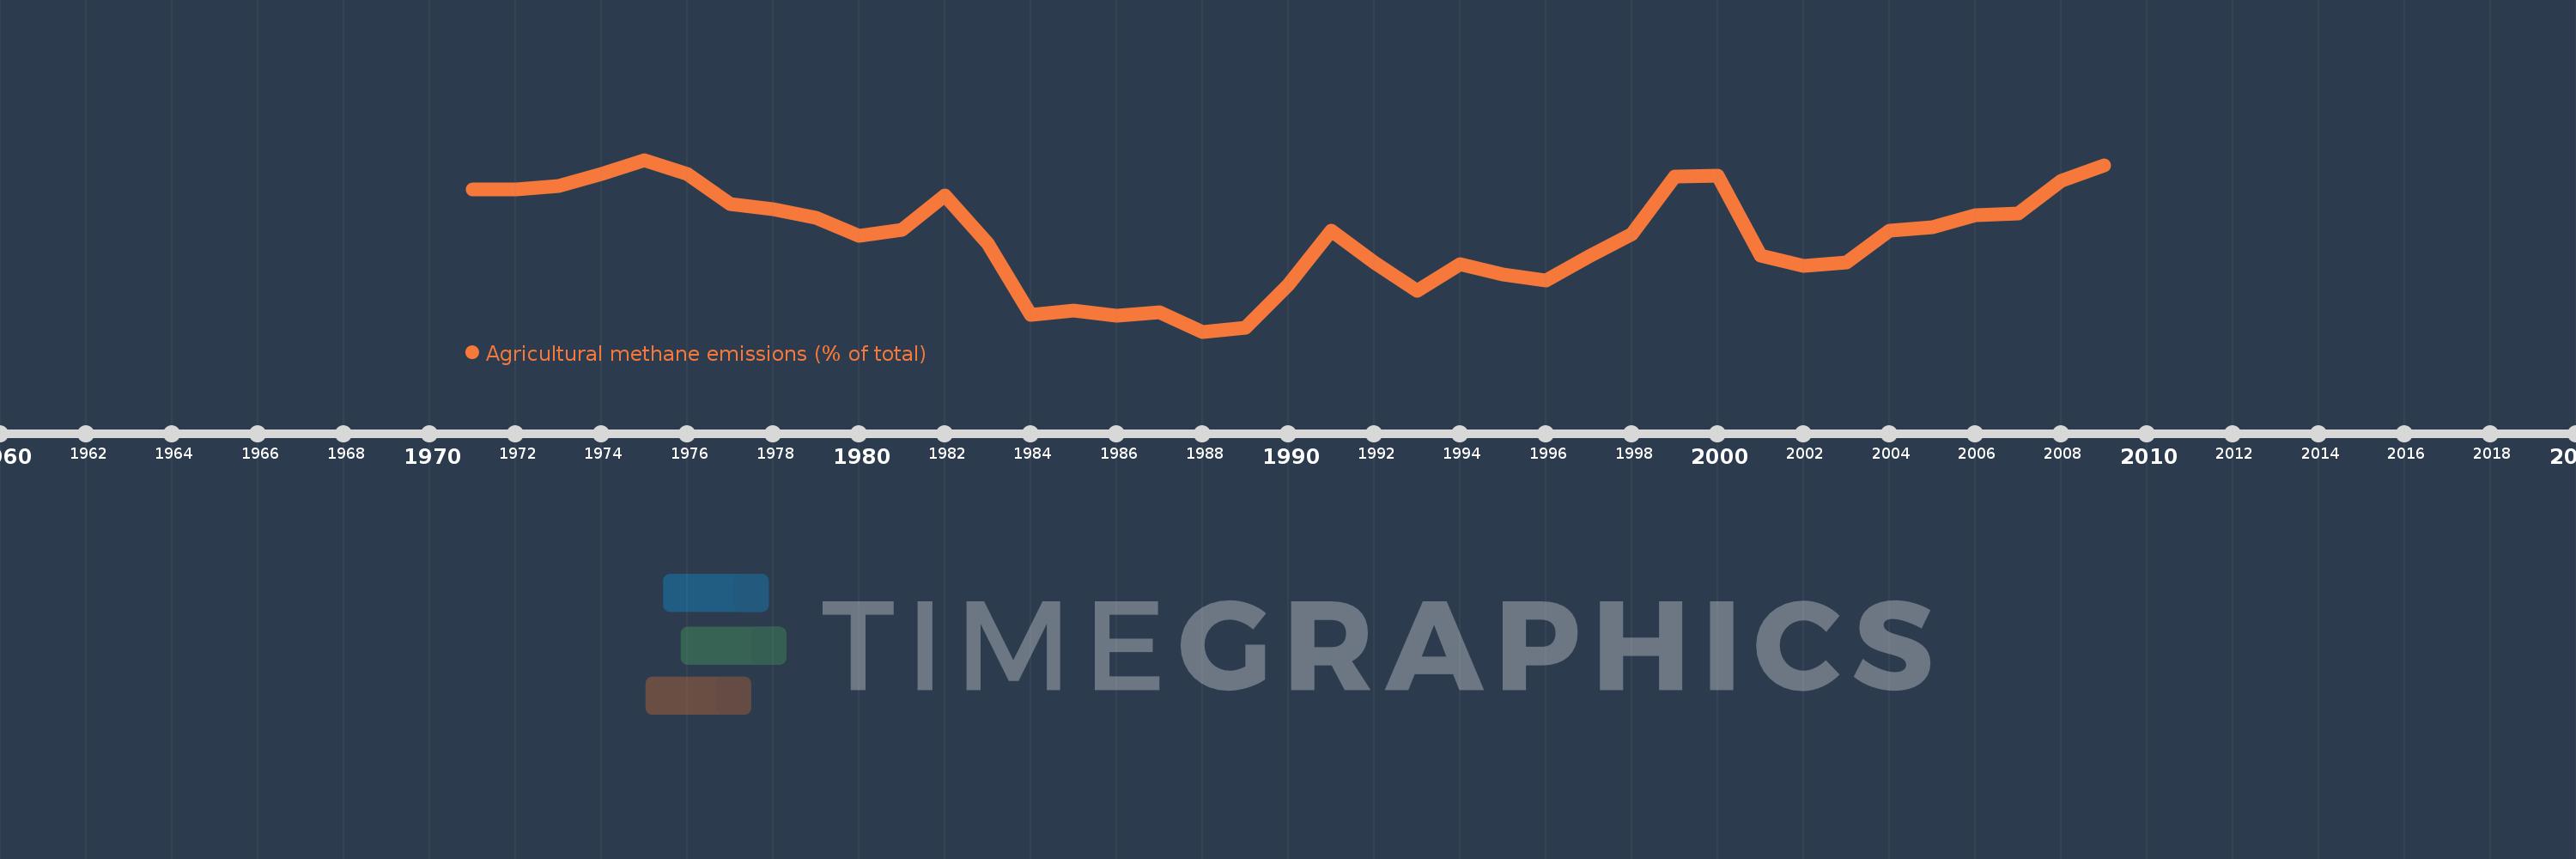
Agricultural methane emissions (% of total)
2009,2008,2007,2006,2005,2004,2003,2002,2001,2000,1999,1998,1997,1996,1995,1994,1993,1992,1991,1990,1989,1988,1987,1986,1985,1984,1983,1982,1981,1980,1979,1978,1977,1976,1975,1974,1973,1972,1971
This statistics in other country:
AfghanistanAlbaniaAlgeriaAmerican SamoaAngolaAntigua and BarbudaArab WorldArgentinaArmeniaArubaAustraliaAustriaAzerbaijanBahamas, TheBahrainBangladeshBarbadosBelarusBelgiumBelizeBeninBermudaBhutanBoliviaBosnia and HerzegovinaBotswanaBrazilBritish Virgin IslandsBrunei DarussalamBulgariaBurkina FasoBurundiCabo VerdeCambodiaCameroonCanadaCaribbean small statesCayman IslandsCentral African RepublicCentral Europe and the BalticsChadChileChinaColombiaComorosCongo, Dem. Rep.Congo, Rep.Costa RicaCote d'IvoireCroatiaCubaCyprusCzech RepublicDenmarkDjiboutiDominicaDominican RepublicEarly-demographic dividendEast Asia & PacificEast Asia & Pacific (excluding high income)East Asia & Pacific (IDA & IBRD countries)EcuadorEgypt, Arab Rep.El SalvadorEquatorial GuineaEritreaEstoniaEthiopiaEuro areaEurope & Central AsiaEurope & Central Asia (excluding high income)Europe & Central Asia (IDA & IBRD countries)European UnionFaroe IslandsFijiFinlandFragile and conflict affected situationsFranceFrench PolynesiaGabonGambia, TheGeorgiaGermanyGhanaGibraltarGreeceGreenlandGrenadaGuamGuatemalaGuineaGuinea-BissauGuyanaHaitiHeavily indebted poor countries (HIPC)High incomeHondurasHong Kong SAR, ChinaHungaryIBRD onlyIcelandIDA & IBRD totalIDA blendIDA onlyIDA totalIndiaIndonesiaIran, Islamic Rep.IraqIrelandIsraelItalyJamaicaJapanJordanKazakhstanKenyaKiribatiKorea, Dem. People’s Rep.Korea, Rep.KuwaitKyrgyz RepublicLao PDRLate-demographic dividendLatin America & Caribbean Latin America & Caribbean (excluding high income)Latin America & the Caribbean (IDA & IBRD countries)LatviaLeast developed countries: UN classificationLebanonLesothoLiberiaLibyaLithuaniaLow & middle incomeLow incomeLower middle incomeLuxembourgMacao SAR, ChinaMacedonia, FYRMadagascarMalawiMalaysiaMaldivesMaliMaltaMarshall IslandsMauritaniaMauritiusMexicoMicronesia, Fed. Sts.Middle East & North AfricaMiddle East & North Africa (excluding high income)Middle East & North Africa (IDA & IBRD countries)Middle incomeMoldovaMongoliaMoroccoMozambiqueMyanmarNamibiaNauruNepalNetherlandsNew CaledoniaNew ZealandNicaraguaNigerNigeriaNorth AmericaNorthern Mariana IslandsNorwayOECD membersOmanOther small statesPacific island small statesPakistanPalauPanamaPapua New GuineaParaguayPeruPhilippinesPolandPortugalPost-demographic dividendPre-demographic dividendPuerto RicoQatarRomaniaRussian FederationRwandaSamoaSao Tome and PrincipeSaudi ArabiaSenegalSerbiaSeychellesSierra LeoneSingaporeSlovak RepublicSloveniaSmall statesSolomon IslandsSomaliaSouth AfricaSouth AsiaSouth Asia (IDA & IBRD)SpainSri LankaSt. Kitts and NevisSt. LuciaSt. Vincent and the GrenadinesSub-Saharan Africa Sub-Saharan Africa (excluding high income)Sub-Saharan Africa (IDA & IBRD countries)SudanSurinameSwazilandSwedenSwitzerlandSyrian Arab RepublicTajikistanTanzaniaThailandTimor-LesteTogoTongaTrinidad and TobagoTunisiaTurkeyTurkmenistanTurks and Caicos IslandsTuvaluUgandaUkraineUnited Arab EmiratesUnited KingdomUnited StatesUpper middle incomeUruguayUzbekistanVanuatuVenezuela, RBVietnamVirgin Islands (U.S.)WorldYemen, Rep.ZambiaZimbabwe Timeline:
This timeline shows a graph from 1971 to 2009 of Poland. No data until 1970. Number of actual observations by date: 39.
Source name:
World Development Indicators
Source organization:
World Bank staff estimates from original source: European Commission, Joint Research Centre (JRC)/Netherlands Environmental Assessment Agency (PBL). Emission Database for Global Atmospheric Research (EDGAR): http://edgar.jrc.ec.europa.eu/.
Categories, topics:
Agriculture & Rural Development, Environment
Last updated:
apr 23, 2017
Indicators value changes by year
Minimum:
17.318
jan 1, 1988
Maximum:
23.864
jan 1, 1975
At the date of observation
Value
Absolute change
Change from previous value
jan 1, 1971
22.74
+22.74
0.0%
jan 1, 1972
22.749
+0.009
0.04%
jan 1, 1973
22.862
+0.113
0.5%
jan 1, 1974
23.335
+0.474
2.07%
jan 1, 1975
23.864
+0.528
2.26%
jan 1, 1976
23.34
-0.524
-2.2%
jan 1, 1977
22.168
-1.172
-5.02%
jan 1, 1978
21.972
-0.196
-0.88%
jan 1, 1979
21.639
-0.333
-1.52%
jan 1, 1980
20.955
-0.684
-3.16%
jan 1, 1981
21.187
+0.233
1.11%
jan 1, 1982
22.503
+1.316
6.21%
jan 1, 1983
20.689
-1.815
-8.06%
jan 1, 1984
17.943
-2.745
-13.27%
jan 1, 1985
18.108
+0.165
0.92%
jan 1, 1986
17.922
-0.186
-1.03%
jan 1, 1987
18.048
+0.126
0.7%
jan 1, 1988
17.318
-0.73
-4.05%
jan 1, 1989
17.458
+0.141
0.81%
jan 1, 1990
19.105
+1.646
9.43%
jan 1, 1991
21.166
+2.061
10.79%
jan 1, 1992
19.938
-1.227
-5.8%
jan 1, 1993
18.883
-1.056
-5.3%
jan 1, 1994
19.898
+1.016
5.38%
jan 1, 1995
19.498
-0.4
-2.01%
jan 1, 1996
19.251
-0.248
-1.27%
jan 1, 1997
20.17
+0.919
4.78%
jan 1, 1998
21.041
+0.871
4.32%
jan 1, 1999
23.227
+2.186
10.39%
jan 1, 2000
23.26
+0.033
0.14%
jan 1, 2001
20.208
-3.051
-13.12%
jan 1, 2002
19.816
-0.393
-1.94%
jan 1, 2003
19.963
+0.147
0.74%
jan 1, 2004
21.166
+1.203
6.02%
jan 1, 2005
21.304
+0.138
0.65%
jan 1, 2006
21.759
+0.455
2.14%
jan 1, 2007
21.823
+0.064
0.29%
jan 1, 2008
23.059
+1.236
5.67%
jan 1, 2009
23.644
+0.585
2.54%
Ranking of countries by current statistics by years


Comments: