29
/
en
AIzaSyAYiBZKx7MnpbEhh9jyipgxe19OcubqV5w
April 1, 2024
146534
Guinea-Bissau
GNB
true
2
1
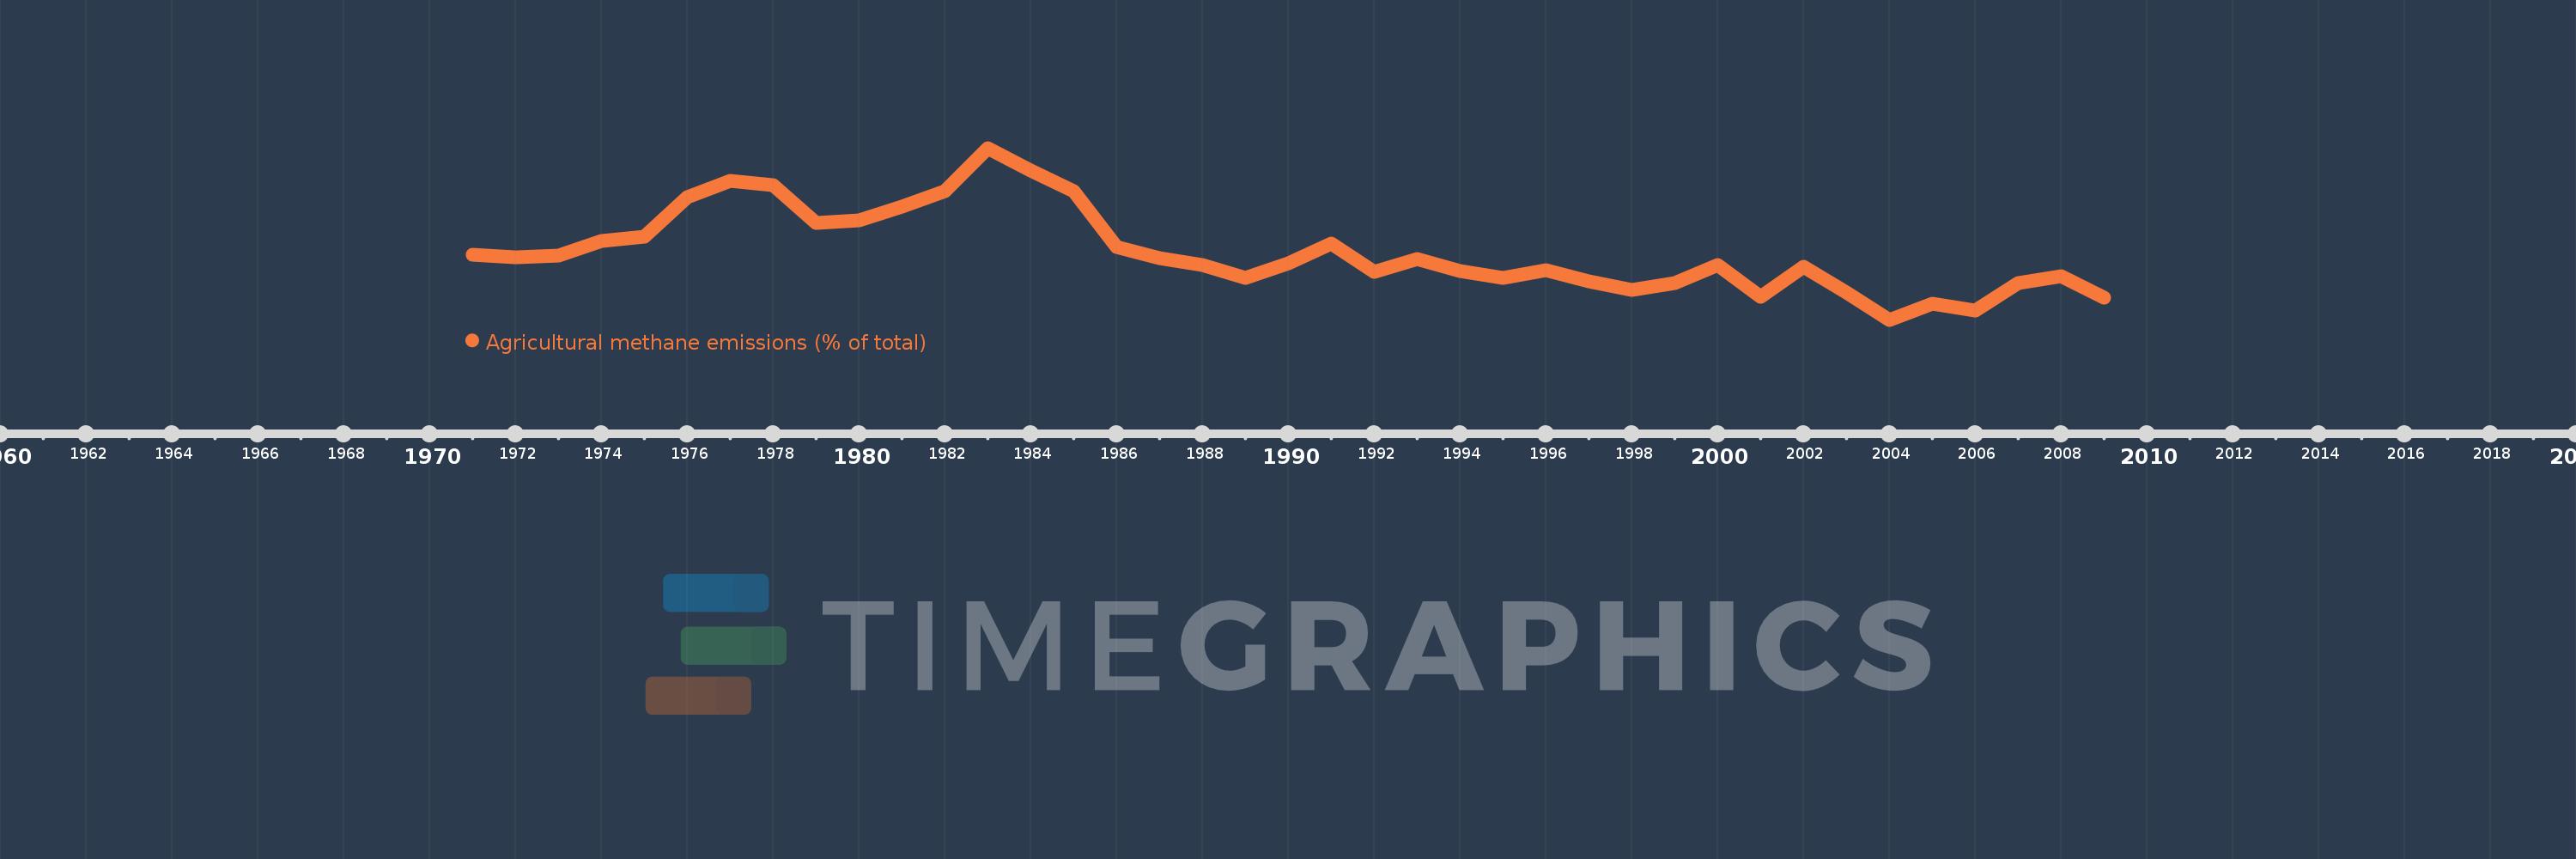
Agricultural methane emissions (% of total)
2009,2008,2007,2006,2005,2004,2003,2002,2001,2000,1999,1998,1997,1996,1995,1994,1993,1992,1991,1990,1989,1988,1987,1986,1985,1984,1983,1982,1981,1980,1979,1978,1977,1976,1975,1974,1973,1972,1971
This statistics in other country:
AfghanistanAlbaniaAlgeriaAmerican SamoaAngolaAntigua and BarbudaArab WorldArgentinaArmeniaArubaAustraliaAustriaAzerbaijanBahamas, TheBahrainBangladeshBarbadosBelarusBelgiumBelizeBeninBermudaBhutanBoliviaBosnia and HerzegovinaBotswanaBrazilBritish Virgin IslandsBrunei DarussalamBulgariaBurkina FasoBurundiCabo VerdeCambodiaCameroonCanadaCaribbean small statesCayman IslandsCentral African RepublicCentral Europe and the BalticsChadChileChinaColombiaComorosCongo, Dem. Rep.Congo, Rep.Costa RicaCote d'IvoireCroatiaCubaCyprusCzech RepublicDenmarkDjiboutiDominicaDominican RepublicEarly-demographic dividendEast Asia & PacificEast Asia & Pacific (excluding high income)East Asia & Pacific (IDA & IBRD countries)EcuadorEgypt, Arab Rep.El SalvadorEquatorial GuineaEritreaEstoniaEthiopiaEuro areaEurope & Central AsiaEurope & Central Asia (excluding high income)Europe & Central Asia (IDA & IBRD countries)European UnionFaroe IslandsFijiFinlandFragile and conflict affected situationsFranceFrench PolynesiaGabonGambia, TheGeorgiaGermanyGhanaGibraltarGreeceGreenlandGrenadaGuamGuatemalaGuineaGuinea-BissauGuyanaHaitiHeavily indebted poor countries (HIPC)High incomeHondurasHong Kong SAR, ChinaHungaryIBRD onlyIcelandIDA & IBRD totalIDA blendIDA onlyIDA totalIndiaIndonesiaIran, Islamic Rep.IraqIrelandIsraelItalyJamaicaJapanJordanKazakhstanKenyaKiribatiKorea, Dem. People’s Rep.Korea, Rep.KuwaitKyrgyz RepublicLao PDRLate-demographic dividendLatin America & Caribbean Latin America & Caribbean (excluding high income)Latin America & the Caribbean (IDA & IBRD countries)LatviaLeast developed countries: UN classificationLebanonLesothoLiberiaLibyaLithuaniaLow & middle incomeLow incomeLower middle incomeLuxembourgMacao SAR, ChinaMacedonia, FYRMadagascarMalawiMalaysiaMaldivesMaliMaltaMarshall IslandsMauritaniaMauritiusMexicoMicronesia, Fed. Sts.Middle East & North AfricaMiddle East & North Africa (excluding high income)Middle East & North Africa (IDA & IBRD countries)Middle incomeMoldovaMongoliaMoroccoMozambiqueMyanmarNamibiaNauruNepalNetherlandsNew CaledoniaNew ZealandNicaraguaNigerNigeriaNorth AmericaNorthern Mariana IslandsNorwayOECD membersOmanOther small statesPacific island small statesPakistanPalauPanamaPapua New GuineaParaguayPeruPhilippinesPolandPortugalPost-demographic dividendPre-demographic dividendPuerto RicoQatarRomaniaRussian FederationRwandaSamoaSao Tome and PrincipeSaudi ArabiaSenegalSerbiaSeychellesSierra LeoneSingaporeSlovak RepublicSloveniaSmall statesSolomon IslandsSomaliaSouth AfricaSouth AsiaSouth Asia (IDA & IBRD)SpainSri LankaSt. Kitts and NevisSt. LuciaSt. Vincent and the GrenadinesSub-Saharan Africa Sub-Saharan Africa (excluding high income)Sub-Saharan Africa (IDA & IBRD countries)SudanSurinameSwazilandSwedenSwitzerlandSyrian Arab RepublicTajikistanTanzaniaThailandTimor-LesteTogoTongaTrinidad and TobagoTunisiaTurkeyTurkmenistanTurks and Caicos IslandsTuvaluUgandaUkraineUnited Arab EmiratesUnited KingdomUnited StatesUpper middle incomeUruguayUzbekistanVanuatuVenezuela, RBVietnamVirgin Islands (U.S.)WorldYemen, Rep.ZambiaZimbabwe Timeline:
This timeline shows a graph from 1971 to 2009 of Guinea-Bissau. No data until 1970. Number of actual observations by date: 39.
Source name:
World Development Indicators
Source organization:
World Bank staff estimates from original source: European Commission, Joint Research Centre (JRC)/Netherlands Environmental Assessment Agency (PBL). Emission Database for Global Atmospheric Research (EDGAR): http://edgar.jrc.ec.europa.eu/.
Categories, topics:
Agriculture & Rural Development, Environment
Last updated:
apr 23, 2017
Indicators value changes by year
Maximum:
89.247
jan 1, 1983
At the date of observation
Value
Absolute change
Change from previous value
jan 1, 1971
82.697
+82.697
0.0%
jan 1, 1972
82.509
-0.188
-0.23%
jan 1, 1973
82.661
+0.152
0.18%
jan 1, 1974
83.534
+0.873
1.06%
jan 1, 1975
83.774
+0.24
0.29%
jan 1, 1976
86.233
+2.459
2.94%
jan 1, 1977
87.237
+1.004
1.16%
jan 1, 1978
86.988
-0.249
-0.29%
jan 1, 1979
84.642
-2.346
-2.7%
jan 1, 1980
84.8
+0.159
0.19%
jan 1, 1981
85.669
+0.869
1.02%
jan 1, 1982
86.604
+0.935
1.09%
jan 1, 1983
89.247
+2.644
3.05%
jan 1, 1984
87.872
-1.376
-1.54%
jan 1, 1985
86.57
-1.301
-1.48%
jan 1, 1986
83.168
-3.402
-3.93%
jan 1, 1987
82.478
-0.69
-0.83%
jan 1, 1988
82.076
-0.402
-0.49%
jan 1, 1989
81.28
-0.796
-0.97%
jan 1, 1990
82.177
+0.897
1.1%
jan 1, 1991
83.376
+1.199
1.46%
jan 1, 1992
81.65
-1.726
-2.07%
jan 1, 1993
82.442
+0.791
0.97%
jan 1, 1994
81.683
-0.759
-0.92%
jan 1, 1995
81.248
-0.435
-0.53%
jan 1, 1996
81.769
+0.521
0.64%
jan 1, 1997
81.076
-0.693
-0.85%
jan 1, 1998
80.507
-0.569
-0.7%
jan 1, 1999
80.965
+0.458
0.57%
jan 1, 2000
82.039
+1.074
1.33%
jan 1, 2001
80.1
-1.939
-2.36%
jan 1, 2002
81.928
+1.828
2.28%
jan 1, 2003
80.37
-1.558
-1.9%
jan 1, 2004
78.7
-1.669
-2.08%
jan 1, 2005
79.69
+0.99
1.26%
jan 1, 2006
79.247
-0.443
-0.56%
jan 1, 2007
80.947
+1.701
2.15%
jan 1, 2008
81.38
+0.432
0.53%
jan 1, 2009
80.06
-1.32
-1.62%
Ranking of countries by current statistics by years


Comments: