29
/
en
AIzaSyAYiBZKx7MnpbEhh9jyipgxe19OcubqV5w
April 1, 2024
171427
Kuwait
KWT
true
2
1
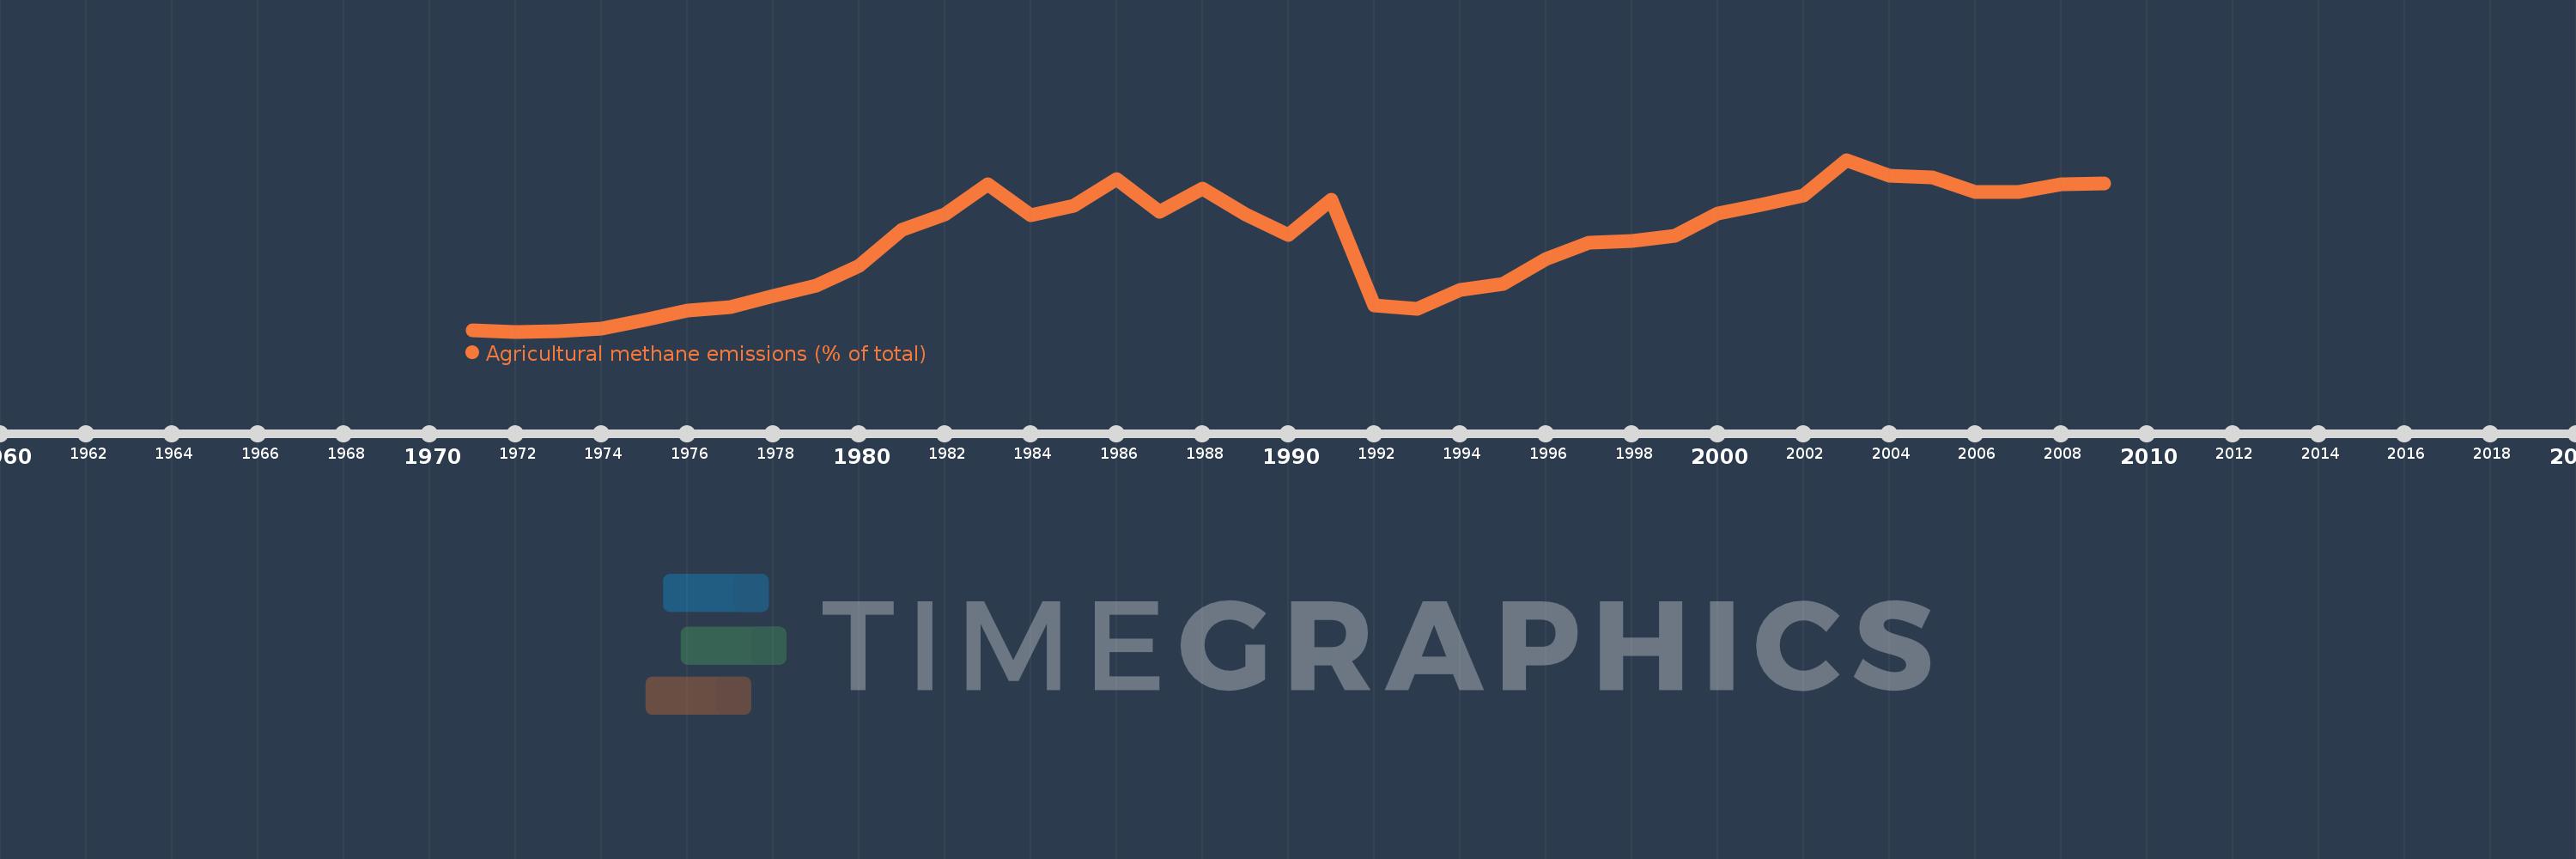
Agricultural methane emissions (% of total)
2009,2008,2007,2006,2005,2004,2003,2002,2001,2000,1999,1998,1997,1996,1995,1994,1993,1992,1991,1990,1989,1988,1987,1986,1985,1984,1983,1982,1981,1980,1979,1978,1977,1976,1975,1974,1973,1972,1971
This statistics in other country:
AfghanistanAlbaniaAlgeriaAmerican SamoaAngolaAntigua and BarbudaArab WorldArgentinaArmeniaArubaAustraliaAustriaAzerbaijanBahamas, TheBahrainBangladeshBarbadosBelarusBelgiumBelizeBeninBermudaBhutanBoliviaBosnia and HerzegovinaBotswanaBrazilBritish Virgin IslandsBrunei DarussalamBulgariaBurkina FasoBurundiCabo VerdeCambodiaCameroonCanadaCaribbean small statesCayman IslandsCentral African RepublicCentral Europe and the BalticsChadChileChinaColombiaComorosCongo, Dem. Rep.Congo, Rep.Costa RicaCote d'IvoireCroatiaCubaCyprusCzech RepublicDenmarkDjiboutiDominicaDominican RepublicEarly-demographic dividendEast Asia & PacificEast Asia & Pacific (excluding high income)East Asia & Pacific (IDA & IBRD countries)EcuadorEgypt, Arab Rep.El SalvadorEquatorial GuineaEritreaEstoniaEthiopiaEuro areaEurope & Central AsiaEurope & Central Asia (excluding high income)Europe & Central Asia (IDA & IBRD countries)European UnionFaroe IslandsFijiFinlandFragile and conflict affected situationsFranceFrench PolynesiaGabonGambia, TheGeorgiaGermanyGhanaGibraltarGreeceGreenlandGrenadaGuamGuatemalaGuineaGuinea-BissauGuyanaHaitiHeavily indebted poor countries (HIPC)High incomeHondurasHong Kong SAR, ChinaHungaryIBRD onlyIcelandIDA & IBRD totalIDA blendIDA onlyIDA totalIndiaIndonesiaIran, Islamic Rep.IraqIrelandIsraelItalyJamaicaJapanJordanKazakhstanKenyaKiribatiKorea, Dem. People’s Rep.Korea, Rep.KuwaitKyrgyz RepublicLao PDRLate-demographic dividendLatin America & Caribbean Latin America & Caribbean (excluding high income)Latin America & the Caribbean (IDA & IBRD countries)LatviaLeast developed countries: UN classificationLebanonLesothoLiberiaLibyaLithuaniaLow & middle incomeLow incomeLower middle incomeLuxembourgMacao SAR, ChinaMacedonia, FYRMadagascarMalawiMalaysiaMaldivesMaliMaltaMarshall IslandsMauritaniaMauritiusMexicoMicronesia, Fed. Sts.Middle East & North AfricaMiddle East & North Africa (excluding high income)Middle East & North Africa (IDA & IBRD countries)Middle incomeMoldovaMongoliaMoroccoMozambiqueMyanmarNamibiaNauruNepalNetherlandsNew CaledoniaNew ZealandNicaraguaNigerNigeriaNorth AmericaNorthern Mariana IslandsNorwayOECD membersOmanOther small statesPacific island small statesPakistanPalauPanamaPapua New GuineaParaguayPeruPhilippinesPolandPortugalPost-demographic dividendPre-demographic dividendPuerto RicoQatarRomaniaRussian FederationRwandaSamoaSao Tome and PrincipeSaudi ArabiaSenegalSerbiaSeychellesSierra LeoneSingaporeSlovak RepublicSloveniaSmall statesSolomon IslandsSomaliaSouth AfricaSouth AsiaSouth Asia (IDA & IBRD)SpainSri LankaSt. Kitts and NevisSt. LuciaSt. Vincent and the GrenadinesSub-Saharan Africa Sub-Saharan Africa (excluding high income)Sub-Saharan Africa (IDA & IBRD countries)SudanSurinameSwazilandSwedenSwitzerlandSyrian Arab RepublicTajikistanTanzaniaThailandTimor-LesteTogoTongaTrinidad and TobagoTunisiaTurkeyTurkmenistanTurks and Caicos IslandsTuvaluUgandaUkraineUnited Arab EmiratesUnited KingdomUnited StatesUpper middle incomeUruguayUzbekistanVanuatuVenezuela, RBVietnamVirgin Islands (U.S.)WorldYemen, Rep.ZambiaZimbabwe Timeline:
This timeline shows a graph from 1971 to 2009 of Kuwait. No data until 1970. Number of actual observations by date: 39.
Source name:
World Development Indicators
Source organization:
World Bank staff estimates from original source: European Commission, Joint Research Centre (JRC)/Netherlands Environmental Assessment Agency (PBL). Emission Database for Global Atmospheric Research (EDGAR): http://edgar.jrc.ec.europa.eu/.
Categories, topics:
Agriculture & Rural Development, Environment
Last updated:
apr 23, 2017
Indicators value changes by year
At the date of observation
Value
Absolute change
Change from previous value
jan 1, 1971
0.15
+0.15
0.0%
jan 1, 1972
0.138
-0.012
-7.72%
jan 1, 1973
0.141
+0.003
1.87%
jan 1, 1974
0.158
+0.017
12.39%
jan 1, 1975
0.223
+0.065
40.8%
jan 1, 1976
0.295
+0.072
32.36%
jan 1, 1977
0.321
+0.026
8.66%
jan 1, 1978
0.401
+0.08
25.0%
jan 1, 1979
0.476
+0.075
18.73%
jan 1, 1980
0.623
+0.147
30.96%
jan 1, 1981
0.893
+0.27
43.27%
jan 1, 1982
1.006
+0.113
12.61%
jan 1, 1983
1.229
+0.223
22.14%
jan 1, 1984
1.0
-0.228
-18.58%
jan 1, 1985
1.069
+0.069
6.9%
jan 1, 1986
1.266
+0.196
18.37%
jan 1, 1987
1.026
-0.24
-18.93%
jan 1, 1988
1.194
+0.168
16.38%
jan 1, 1989
1.006
-0.188
-15.75%
jan 1, 1990
0.854
-0.152
-15.1%
jan 1, 1991
1.116
+0.262
30.7%
jan 1, 1992
0.334
-0.782
-70.04%
jan 1, 1993
0.307
-0.027
-8.11%
jan 1, 1994
0.444
+0.136
44.35%
jan 1, 1995
0.488
+0.045
10.08%
jan 1, 1996
0.676
+0.187
38.35%
jan 1, 1997
0.799
+0.123
18.2%
jan 1, 1998
0.809
+0.01
1.25%
jan 1, 1999
0.848
+0.039
4.83%
jan 1, 2000
1.013
+0.166
19.56%
jan 1, 2001
1.076
+0.063
6.23%
jan 1, 2002
1.143
+0.067
6.19%
jan 1, 2003
1.41
+0.267
23.39%
jan 1, 2004
1.291
-0.119
-8.47%
jan 1, 2005
1.279
-0.012
-0.9%
jan 1, 2006
1.173
-0.106
-8.3%
jan 1, 2007
1.171
-0.002
-0.17%
jan 1, 2008
1.229
+0.058
4.92%
jan 1, 2009
1.233
+0.004
0.32%
Ranking of countries by current statistics by years


Comments: