29
/
en
AIzaSyAYiBZKx7MnpbEhh9jyipgxe19OcubqV5w
April 1, 2024
31296
Europe & Central Asia (excluding high income)
ECA
false
2
1
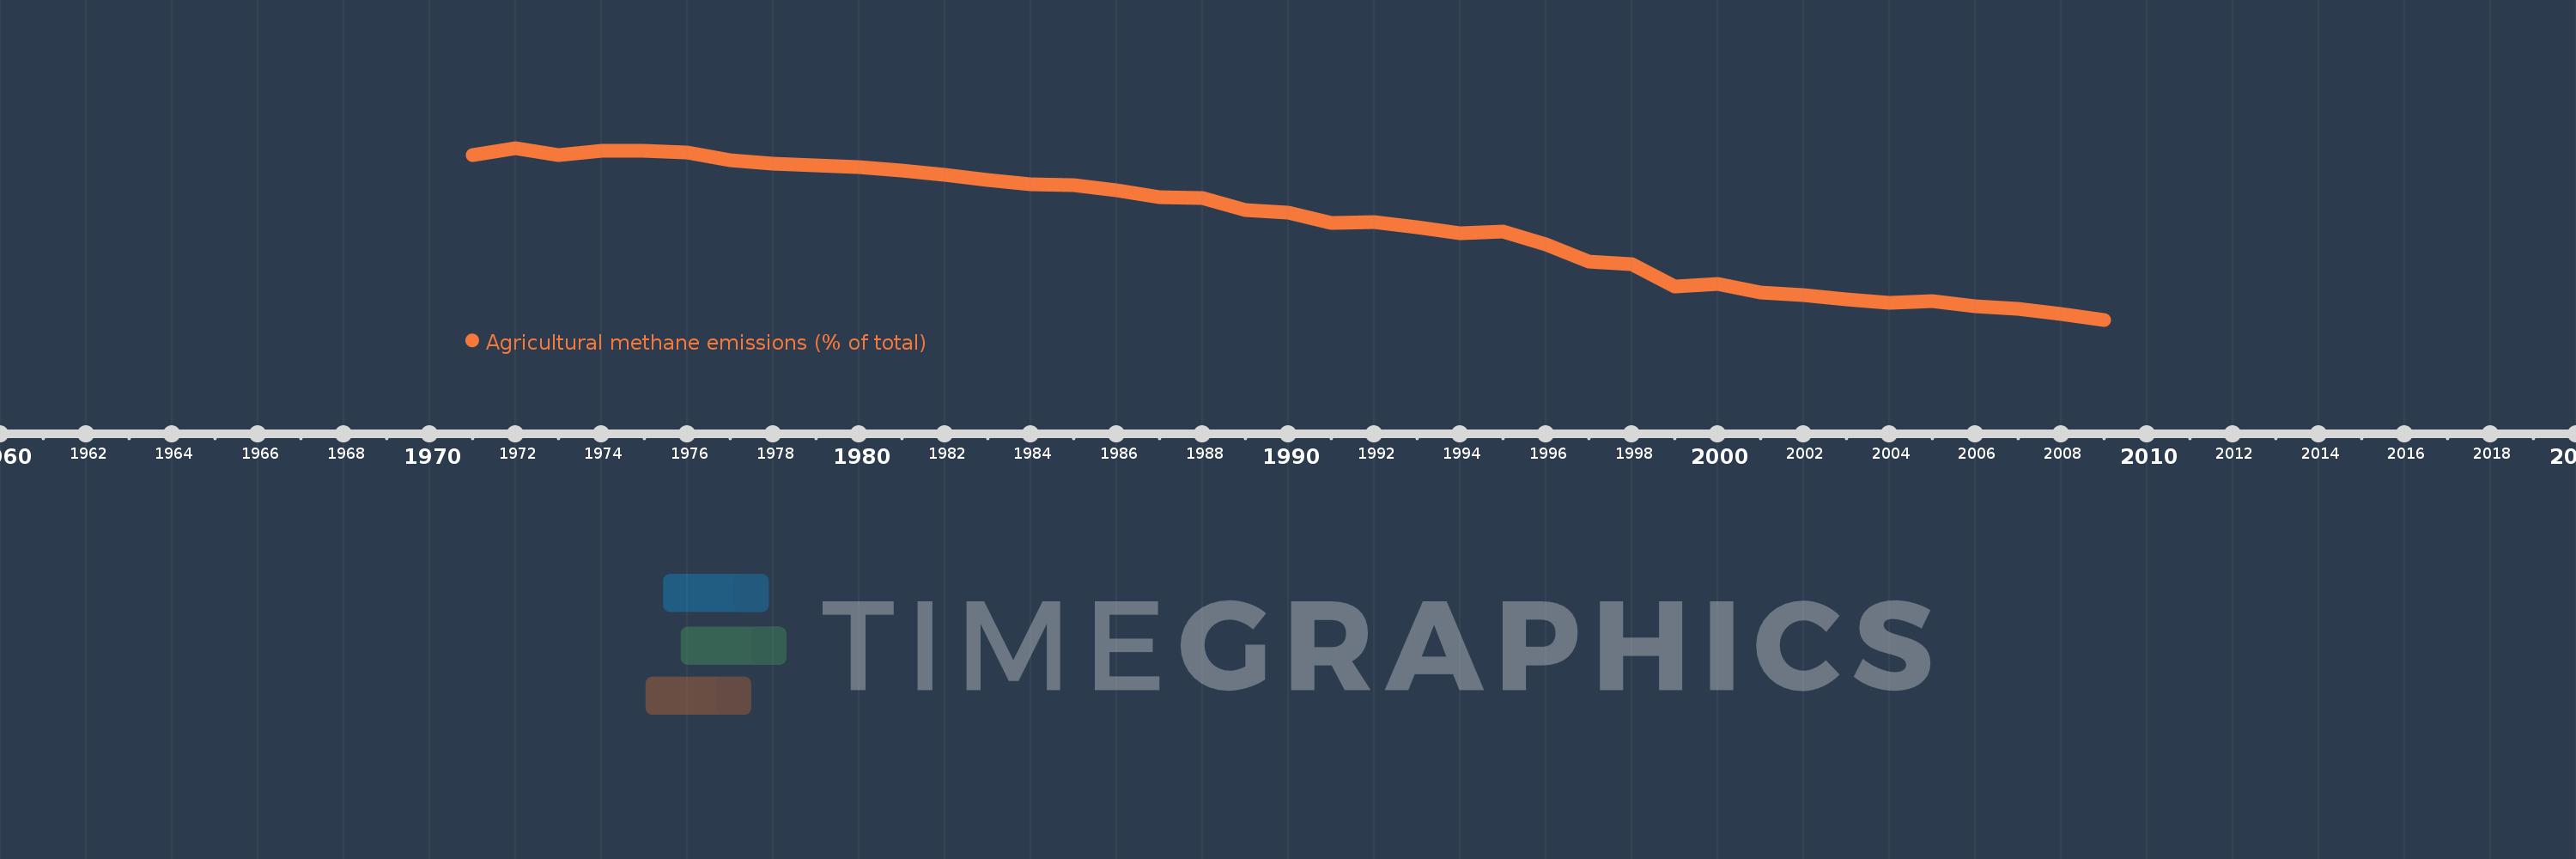
Agricultural methane emissions (% of total)
2009,2008,2007,2006,2005,2004,2003,2002,2001,2000,1999,1998,1997,1996,1995,1994,1993,1992,1991,1990,1989,1988,1987,1986,1985,1984,1983,1982,1981,1980,1979,1978,1977,1976,1975,1974,1973,1972,1971
This statistics in other country:
AfghanistanAlbaniaAlgeriaAmerican SamoaAngolaAntigua and BarbudaArab WorldArgentinaArmeniaArubaAustraliaAustriaAzerbaijanBahamas, TheBahrainBangladeshBarbadosBelarusBelgiumBelizeBeninBermudaBhutanBoliviaBosnia and HerzegovinaBotswanaBrazilBritish Virgin IslandsBrunei DarussalamBulgariaBurkina FasoBurundiCabo VerdeCambodiaCameroonCanadaCaribbean small statesCayman IslandsCentral African RepublicCentral Europe and the BalticsChadChileChinaColombiaComorosCongo, Dem. Rep.Congo, Rep.Costa RicaCote d'IvoireCroatiaCubaCyprusCzech RepublicDenmarkDjiboutiDominicaDominican RepublicEarly-demographic dividendEast Asia & PacificEast Asia & Pacific (excluding high income)East Asia & Pacific (IDA & IBRD countries)EcuadorEgypt, Arab Rep.El SalvadorEquatorial GuineaEritreaEstoniaEthiopiaEuro areaEurope & Central AsiaEurope & Central Asia (excluding high income)Europe & Central Asia (IDA & IBRD countries)European UnionFaroe IslandsFijiFinlandFragile and conflict affected situationsFranceFrench PolynesiaGabonGambia, TheGeorgiaGermanyGhanaGibraltarGreeceGreenlandGrenadaGuamGuatemalaGuineaGuinea-BissauGuyanaHaitiHeavily indebted poor countries (HIPC)High incomeHondurasHong Kong SAR, ChinaHungaryIBRD onlyIcelandIDA & IBRD totalIDA blendIDA onlyIDA totalIndiaIndonesiaIran, Islamic Rep.IraqIrelandIsraelItalyJamaicaJapanJordanKazakhstanKenyaKiribatiKorea, Dem. People’s Rep.Korea, Rep.KuwaitKyrgyz RepublicLao PDRLate-demographic dividendLatin America & Caribbean Latin America & Caribbean (excluding high income)Latin America & the Caribbean (IDA & IBRD countries)LatviaLeast developed countries: UN classificationLebanonLesothoLiberiaLibyaLithuaniaLow & middle incomeLow incomeLower middle incomeLuxembourgMacao SAR, ChinaMacedonia, FYRMadagascarMalawiMalaysiaMaldivesMaliMaltaMarshall IslandsMauritaniaMauritiusMexicoMicronesia, Fed. Sts.Middle East & North AfricaMiddle East & North Africa (excluding high income)Middle East & North Africa (IDA & IBRD countries)Middle incomeMoldovaMongoliaMoroccoMozambiqueMyanmarNamibiaNauruNepalNetherlandsNew CaledoniaNew ZealandNicaraguaNigerNigeriaNorth AmericaNorthern Mariana IslandsNorwayOECD membersOmanOther small statesPacific island small statesPakistanPalauPanamaPapua New GuineaParaguayPeruPhilippinesPolandPortugalPost-demographic dividendPre-demographic dividendPuerto RicoQatarRomaniaRussian FederationRwandaSamoaSao Tome and PrincipeSaudi ArabiaSenegalSerbiaSeychellesSierra LeoneSingaporeSlovak RepublicSloveniaSmall statesSolomon IslandsSomaliaSouth AfricaSouth AsiaSouth Asia (IDA & IBRD)SpainSri LankaSt. Kitts and NevisSt. LuciaSt. Vincent and the GrenadinesSub-Saharan Africa Sub-Saharan Africa (excluding high income)Sub-Saharan Africa (IDA & IBRD countries)SudanSurinameSwazilandSwedenSwitzerlandSyrian Arab RepublicTajikistanTanzaniaThailandTimor-LesteTogoTongaTrinidad and TobagoTunisiaTurkeyTurkmenistanTurks and Caicos IslandsTuvaluUgandaUkraineUnited Arab EmiratesUnited KingdomUnited StatesUpper middle incomeUruguayUzbekistanVanuatuVenezuela, RBVietnamVirgin Islands (U.S.)WorldYemen, Rep.ZambiaZimbabwe Timeline:
This timeline shows a graph from 1971 to 2009 of Europe & Central Asia (excluding high income). No data until 1970. Number of actual observations by date: 39.
Source name:
World Development Indicators
Source organization:
World Bank staff estimates from original source: European Commission, Joint Research Centre (JRC)/Netherlands Environmental Assessment Agency (PBL). Emission Database for Global Atmospheric Research (EDGAR): http://edgar.jrc.ec.europa.eu/.
Categories, topics:
Agriculture & Rural Development, Environment
Last updated:
apr 23, 2017
Indicators value changes by year
Minimum:
16.632
jan 1, 2009
Maximum:
39.468
jan 1, 1972
At the date of observation
Value
Absolute change
Change from previous value
jan 1, 1971
38.494
+38.494
0.0%
jan 1, 1972
39.468
+0.974
2.53%
jan 1, 1973
38.49
-0.978
-2.48%
jan 1, 1974
39.043
+0.552
1.44%
jan 1, 1975
39.136
+0.093
0.24%
jan 1, 1976
38.85
-0.286
-0.73%
jan 1, 1977
37.808
-1.041
-2.68%
jan 1, 1978
37.382
-0.427
-1.13%
jan 1, 1979
37.109
-0.273
-0.73%
jan 1, 1980
36.954
-0.154
-0.42%
jan 1, 1981
36.436
-0.518
-1.4%
jan 1, 1982
35.841
-0.596
-1.63%
jan 1, 1983
35.191
-0.65
-1.81%
jan 1, 1984
34.63
-0.561
-1.59%
jan 1, 1985
34.482
-0.148
-0.43%
jan 1, 1986
33.849
-0.633
-1.84%
jan 1, 1987
32.944
-0.904
-2.67%
jan 1, 1988
32.756
-0.189
-0.57%
jan 1, 1989
31.202
-1.554
-4.74%
jan 1, 1990
30.888
-0.314
-1.01%
jan 1, 1991
29.524
-1.364
-4.42%
jan 1, 1992
29.648
+0.124
0.42%
jan 1, 1993
28.96
-0.689
-2.32%
jan 1, 1994
28.172
-0.788
-2.72%
jan 1, 1995
28.32
+0.149
0.53%
jan 1, 1996
26.688
-1.633
-5.76%
jan 1, 1997
24.406
-2.282
-8.55%
jan 1, 1998
24.016
-0.39
-1.6%
jan 1, 1999
21.047
-2.969
-12.36%
jan 1, 2000
21.34
+0.293
1.39%
jan 1, 2001
20.204
-1.136
-5.32%
jan 1, 2002
19.868
-0.336
-1.66%
jan 1, 2003
19.302
-0.566
-2.85%
jan 1, 2004
18.888
-0.414
-2.15%
jan 1, 2005
19.11
+0.222
1.18%
jan 1, 2006
18.445
-0.665
-3.48%
jan 1, 2007
18.079
-0.366
-1.98%
jan 1, 2008
17.454
-0.625
-3.46%
jan 1, 2009
16.632
-0.822
-4.71%
Ranking of countries by current statistics by years


Comments: