29
/
en
AIzaSyAYiBZKx7MnpbEhh9jyipgxe19OcubqV5w
April 1, 2024
261852
Thailand
THA
true
2
1
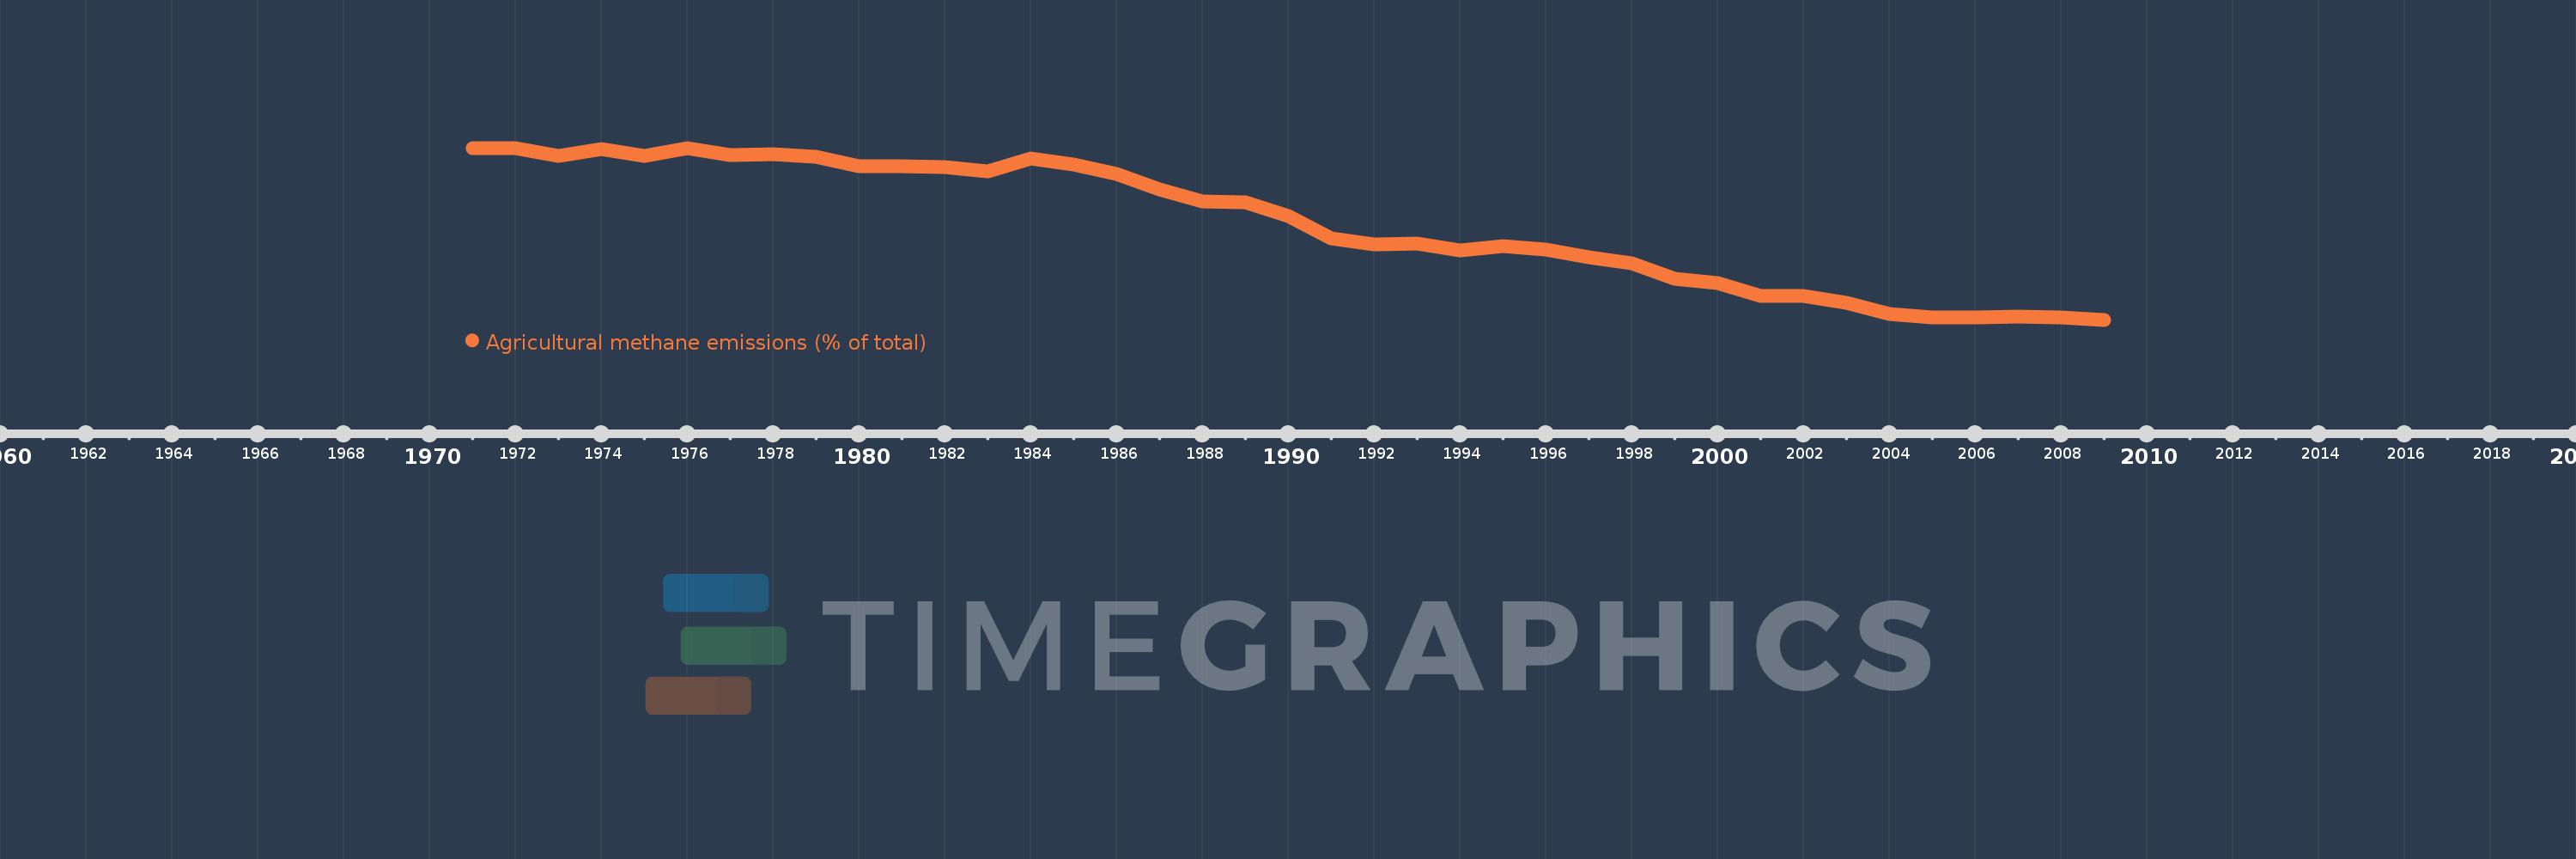
Agricultural methane emissions (% of total)
2009,2008,2007,2006,2005,2004,2003,2002,2001,2000,1999,1998,1997,1996,1995,1994,1993,1992,1991,1990,1989,1988,1987,1986,1985,1984,1983,1982,1981,1980,1979,1978,1977,1976,1975,1974,1973,1972,1971
This statistics in other country:
AfghanistanAlbaniaAlgeriaAmerican SamoaAngolaAntigua and BarbudaArab WorldArgentinaArmeniaArubaAustraliaAustriaAzerbaijanBahamas, TheBahrainBangladeshBarbadosBelarusBelgiumBelizeBeninBermudaBhutanBoliviaBosnia and HerzegovinaBotswanaBrazilBritish Virgin IslandsBrunei DarussalamBulgariaBurkina FasoBurundiCabo VerdeCambodiaCameroonCanadaCaribbean small statesCayman IslandsCentral African RepublicCentral Europe and the BalticsChadChileChinaColombiaComorosCongo, Dem. Rep.Congo, Rep.Costa RicaCote d'IvoireCroatiaCubaCyprusCzech RepublicDenmarkDjiboutiDominicaDominican RepublicEarly-demographic dividendEast Asia & PacificEast Asia & Pacific (excluding high income)East Asia & Pacific (IDA & IBRD countries)EcuadorEgypt, Arab Rep.El SalvadorEquatorial GuineaEritreaEstoniaEthiopiaEuro areaEurope & Central AsiaEurope & Central Asia (excluding high income)Europe & Central Asia (IDA & IBRD countries)European UnionFaroe IslandsFijiFinlandFragile and conflict affected situationsFranceFrench PolynesiaGabonGambia, TheGeorgiaGermanyGhanaGibraltarGreeceGreenlandGrenadaGuamGuatemalaGuineaGuinea-BissauGuyanaHaitiHeavily indebted poor countries (HIPC)High incomeHondurasHong Kong SAR, ChinaHungaryIBRD onlyIcelandIDA & IBRD totalIDA blendIDA onlyIDA totalIndiaIndonesiaIran, Islamic Rep.IraqIrelandIsraelItalyJamaicaJapanJordanKazakhstanKenyaKiribatiKorea, Dem. People’s Rep.Korea, Rep.KuwaitKyrgyz RepublicLao PDRLate-demographic dividendLatin America & Caribbean Latin America & Caribbean (excluding high income)Latin America & the Caribbean (IDA & IBRD countries)LatviaLeast developed countries: UN classificationLebanonLesothoLiberiaLibyaLithuaniaLow & middle incomeLow incomeLower middle incomeLuxembourgMacao SAR, ChinaMacedonia, FYRMadagascarMalawiMalaysiaMaldivesMaliMaltaMarshall IslandsMauritaniaMauritiusMexicoMicronesia, Fed. Sts.Middle East & North AfricaMiddle East & North Africa (excluding high income)Middle East & North Africa (IDA & IBRD countries)Middle incomeMoldovaMongoliaMoroccoMozambiqueMyanmarNamibiaNauruNepalNetherlandsNew CaledoniaNew ZealandNicaraguaNigerNigeriaNorth AmericaNorthern Mariana IslandsNorwayOECD membersOmanOther small statesPacific island small statesPakistanPalauPanamaPapua New GuineaParaguayPeruPhilippinesPolandPortugalPost-demographic dividendPre-demographic dividendPuerto RicoQatarRomaniaRussian FederationRwandaSamoaSao Tome and PrincipeSaudi ArabiaSenegalSerbiaSeychellesSierra LeoneSingaporeSlovak RepublicSloveniaSmall statesSolomon IslandsSomaliaSouth AfricaSouth AsiaSouth Asia (IDA & IBRD)SpainSri LankaSt. Kitts and NevisSt. LuciaSt. Vincent and the GrenadinesSub-Saharan Africa Sub-Saharan Africa (excluding high income)Sub-Saharan Africa (IDA & IBRD countries)SudanSurinameSwazilandSwedenSwitzerlandSyrian Arab RepublicTajikistanTanzaniaThailandTimor-LesteTogoTongaTrinidad and TobagoTunisiaTurkeyTurkmenistanTurks and Caicos IslandsTuvaluUgandaUkraineUnited Arab EmiratesUnited KingdomUnited StatesUpper middle incomeUruguayUzbekistanVanuatuVenezuela, RBVietnamVirgin Islands (U.S.)WorldYemen, Rep.ZambiaZimbabwe Timeline:
This timeline shows a graph from 1971 to 2009 of Thailand. No data until 1970. Number of actual observations by date: 39.
Source name:
World Development Indicators
Source organization:
World Bank staff estimates from original source: European Commission, Joint Research Centre (JRC)/Netherlands Environmental Assessment Agency (PBL). Emission Database for Global Atmospheric Research (EDGAR): http://edgar.jrc.ec.europa.eu/.
Categories, topics:
Agriculture & Rural Development, Environment
Last updated:
apr 23, 2017
Indicators value changes by year
Minimum:
62.419
jan 1, 2009
Maximum:
83.129
jan 1, 1972
At the date of observation
Value
Absolute change
Change from previous value
jan 1, 1971
83.076
+83.076
0.0%
jan 1, 1972
83.129
+0.053
0.06%
jan 1, 1973
82.156
-0.972
-1.17%
jan 1, 1974
82.98
+0.823
1.0%
jan 1, 1975
82.163
-0.816
-0.98%
jan 1, 1976
83.067
+0.903
1.1%
jan 1, 1977
82.302
-0.765
-0.92%
jan 1, 1978
82.333
+0.031
0.04%
jan 1, 1979
82.032
-0.301
-0.37%
jan 1, 1980
80.956
-1.076
-1.31%
jan 1, 1981
80.942
-0.014
-0.02%
jan 1, 1982
80.802
-0.14
-0.17%
jan 1, 1983
80.308
-0.494
-0.61%
jan 1, 1984
81.903
+1.595
1.99%
jan 1, 1985
81.176
-0.727
-0.89%
jan 1, 1986
80.024
-1.152
-1.42%
jan 1, 1987
78.104
-1.92
-2.4%
jan 1, 1988
76.691
-1.413
-1.81%
jan 1, 1989
76.588
-0.104
-0.14%
jan 1, 1990
74.903
-1.685
-2.2%
jan 1, 1991
72.181
-2.722
-3.63%
jan 1, 1992
71.516
-0.664
-0.92%
jan 1, 1993
71.61
+0.094
0.13%
jan 1, 1994
70.724
-0.886
-1.24%
jan 1, 1995
71.328
+0.604
0.85%
jan 1, 1996
70.887
-0.441
-0.62%
jan 1, 1997
69.966
-0.921
-1.3%
jan 1, 1998
69.173
-0.793
-1.13%
jan 1, 1999
67.315
-1.858
-2.69%
jan 1, 2000
66.849
-0.466
-0.69%
jan 1, 2001
65.258
-1.591
-2.38%
jan 1, 2002
65.255
-0.002
0.0%
jan 1, 2003
64.479
-0.776
-1.19%
jan 1, 2004
63.11
-1.369
-2.12%
jan 1, 2005
62.748
-0.361
-0.57%
jan 1, 2006
62.653
-0.095
-0.15%
jan 1, 2007
62.815
+0.162
0.26%
jan 1, 2008
62.721
-0.094
-0.15%
jan 1, 2009
62.419
-0.302
-0.48%
Ranking of countries by current statistics by years


Comments: