29
/
en
AIzaSyAYiBZKx7MnpbEhh9jyipgxe19OcubqV5w
April 1, 2024
62368
World
WLD
false
2
1
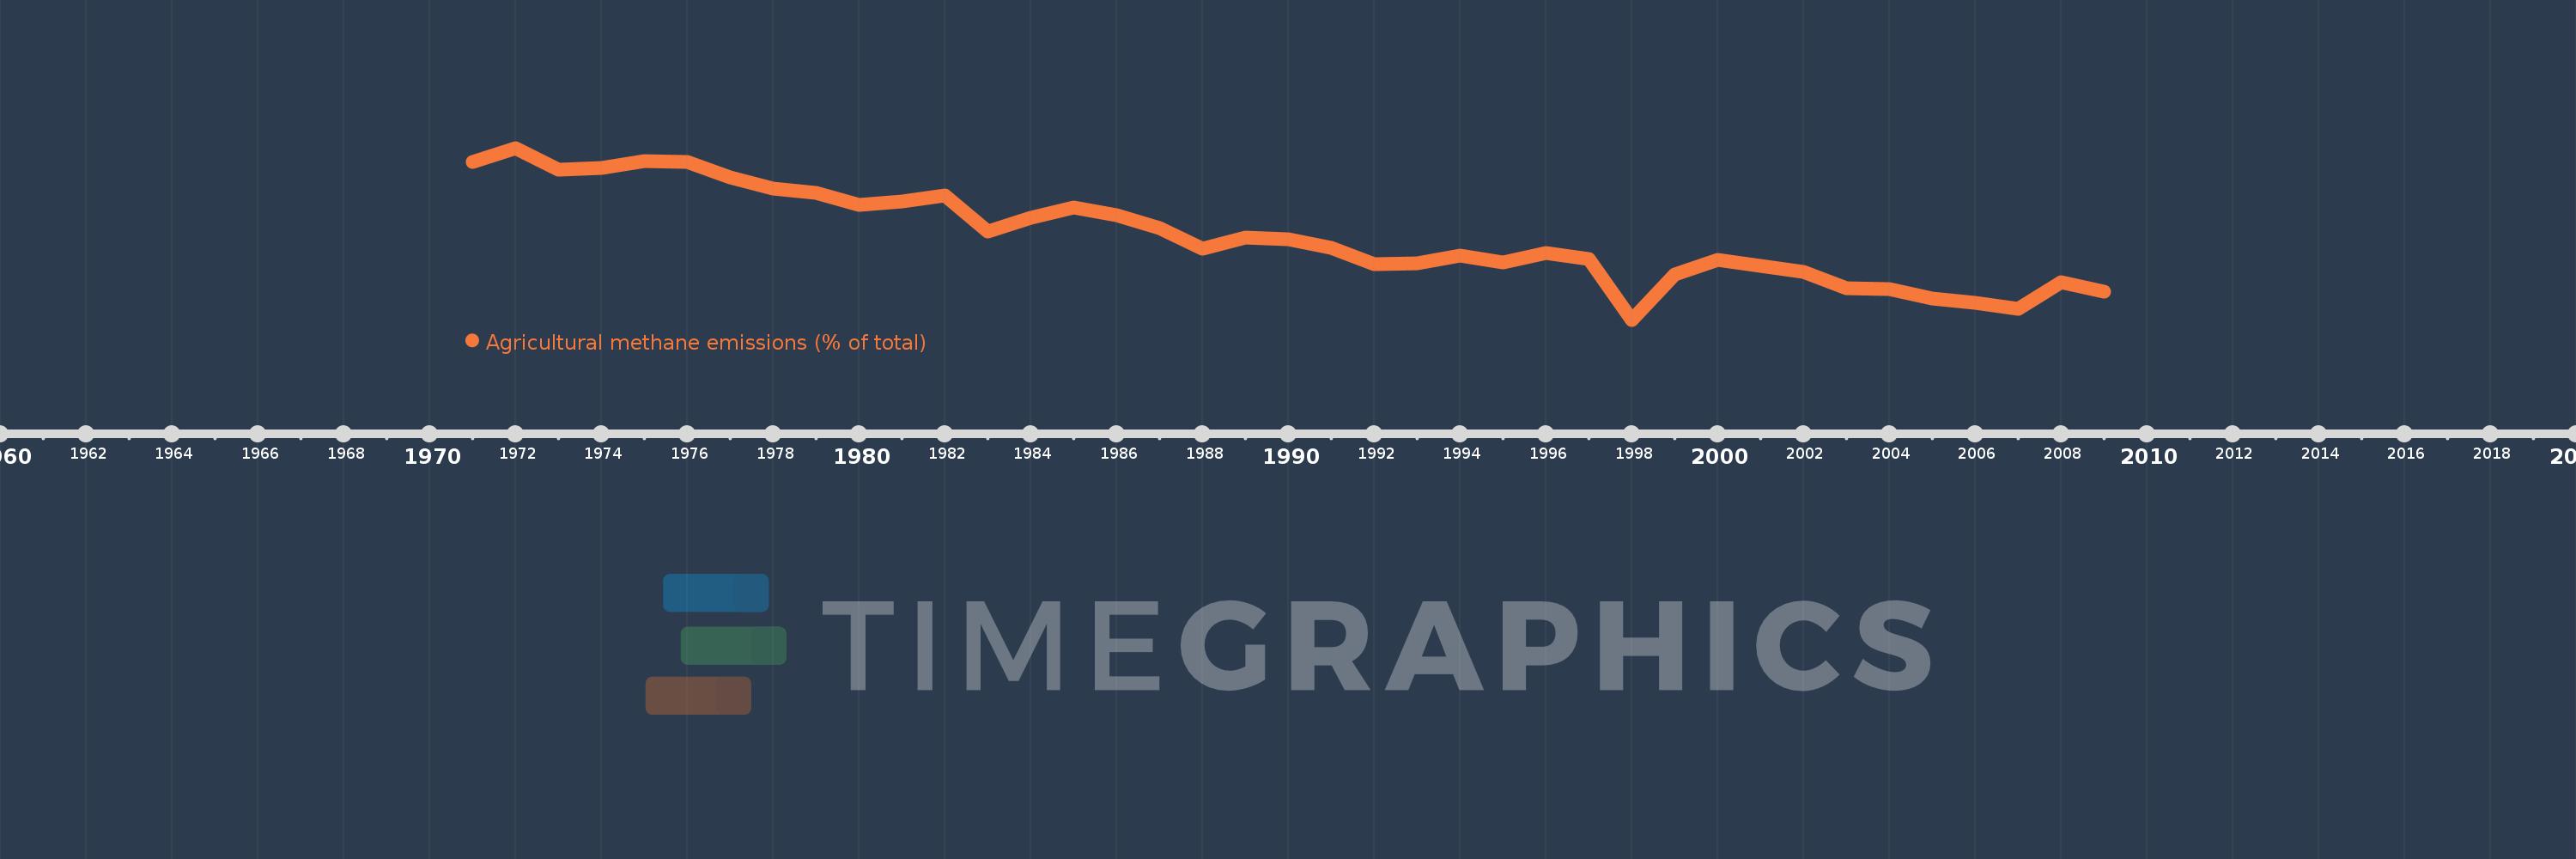
Agricultural methane emissions (% of total)
2009,2008,2007,2006,2005,2004,2003,2002,2001,2000,1999,1998,1997,1996,1995,1994,1993,1992,1991,1990,1989,1988,1987,1986,1985,1984,1983,1982,1981,1980,1979,1978,1977,1976,1975,1974,1973,1972,1971
This statistics in other country:
AfghanistanAlbaniaAlgeriaAmerican SamoaAngolaAntigua and BarbudaArab WorldArgentinaArmeniaArubaAustraliaAustriaAzerbaijanBahamas, TheBahrainBangladeshBarbadosBelarusBelgiumBelizeBeninBermudaBhutanBoliviaBosnia and HerzegovinaBotswanaBrazilBritish Virgin IslandsBrunei DarussalamBulgariaBurkina FasoBurundiCabo VerdeCambodiaCameroonCanadaCaribbean small statesCayman IslandsCentral African RepublicCentral Europe and the BalticsChadChileChinaColombiaComorosCongo, Dem. Rep.Congo, Rep.Costa RicaCote d'IvoireCroatiaCubaCyprusCzech RepublicDenmarkDjiboutiDominicaDominican RepublicEarly-demographic dividendEast Asia & PacificEast Asia & Pacific (excluding high income)East Asia & Pacific (IDA & IBRD countries)EcuadorEgypt, Arab Rep.El SalvadorEquatorial GuineaEritreaEstoniaEthiopiaEuro areaEurope & Central AsiaEurope & Central Asia (excluding high income)Europe & Central Asia (IDA & IBRD countries)European UnionFaroe IslandsFijiFinlandFragile and conflict affected situationsFranceFrench PolynesiaGabonGambia, TheGeorgiaGermanyGhanaGibraltarGreeceGreenlandGrenadaGuamGuatemalaGuineaGuinea-BissauGuyanaHaitiHeavily indebted poor countries (HIPC)High incomeHondurasHong Kong SAR, ChinaHungaryIBRD onlyIcelandIDA & IBRD totalIDA blendIDA onlyIDA totalIndiaIndonesiaIran, Islamic Rep.IraqIrelandIsraelItalyJamaicaJapanJordanKazakhstanKenyaKiribatiKorea, Dem. People’s Rep.Korea, Rep.KuwaitKyrgyz RepublicLao PDRLate-demographic dividendLatin America & Caribbean Latin America & Caribbean (excluding high income)Latin America & the Caribbean (IDA & IBRD countries)LatviaLeast developed countries: UN classificationLebanonLesothoLiberiaLibyaLithuaniaLow & middle incomeLow incomeLower middle incomeLuxembourgMacao SAR, ChinaMacedonia, FYRMadagascarMalawiMalaysiaMaldivesMaliMaltaMarshall IslandsMauritaniaMauritiusMexicoMicronesia, Fed. Sts.Middle East & North AfricaMiddle East & North Africa (excluding high income)Middle East & North Africa (IDA & IBRD countries)Middle incomeMoldovaMongoliaMoroccoMozambiqueMyanmarNamibiaNauruNepalNetherlandsNew CaledoniaNew ZealandNicaraguaNigerNigeriaNorth AmericaNorthern Mariana IslandsNorwayOECD membersOmanOther small statesPacific island small statesPakistanPalauPanamaPapua New GuineaParaguayPeruPhilippinesPolandPortugalPost-demographic dividendPre-demographic dividendPuerto RicoQatarRomaniaRussian FederationRwandaSamoaSao Tome and PrincipeSaudi ArabiaSenegalSerbiaSeychellesSierra LeoneSingaporeSlovak RepublicSloveniaSmall statesSolomon IslandsSomaliaSouth AfricaSouth AsiaSouth Asia (IDA & IBRD)SpainSri LankaSt. Kitts and NevisSt. LuciaSt. Vincent and the GrenadinesSub-Saharan Africa Sub-Saharan Africa (excluding high income)Sub-Saharan Africa (IDA & IBRD countries)SudanSurinameSwazilandSwedenSwitzerlandSyrian Arab RepublicTajikistanTanzaniaThailandTimor-LesteTogoTongaTrinidad and TobagoTunisiaTurkeyTurkmenistanTurks and Caicos IslandsTuvaluUgandaUkraineUnited Arab EmiratesUnited KingdomUnited StatesUpper middle incomeUruguayUzbekistanVanuatuVenezuela, RBVietnamVirgin Islands (U.S.)WorldYemen, Rep.ZambiaZimbabwe Timeline:
This timeline shows a graph from 1971 to 2009 of World. No data until 1970. Number of actual observations by date: 39.
Source name:
World Development Indicators
Source organization:
World Bank staff estimates from original source: European Commission, Joint Research Centre (JRC)/Netherlands Environmental Assessment Agency (PBL). Emission Database for Global Atmospheric Research (EDGAR): http://edgar.jrc.ec.europa.eu/.
Categories, topics:
Agriculture & Rural Development, Environment
Last updated:
apr 23, 2017
Indicators value changes by year
Minimum:
42.229
jan 1, 1998
Maximum:
55.338
jan 1, 1972
At the date of observation
Value
Absolute change
Change from previous value
jan 1, 1971
54.295
+54.295
0.0%
jan 1, 1972
55.338
+1.043
1.92%
jan 1, 1973
53.685
-1.653
-2.99%
jan 1, 1974
53.831
+0.146
0.27%
jan 1, 1975
54.326
+0.495
0.92%
jan 1, 1976
54.271
-0.055
-0.1%
jan 1, 1977
53.094
-1.178
-2.17%
jan 1, 1978
52.264
-0.829
-1.56%
jan 1, 1979
51.931
-0.334
-0.64%
jan 1, 1980
51.004
-0.926
-1.78%
jan 1, 1981
51.228
+0.223
0.44%
jan 1, 1982
51.688
+0.46
0.9%
jan 1, 1983
48.944
-2.744
-5.31%
jan 1, 1984
49.989
+1.045
2.13%
jan 1, 1985
50.814
+0.825
1.65%
jan 1, 1986
50.231
-0.583
-1.15%
jan 1, 1987
49.212
-1.019
-2.03%
jan 1, 1988
47.654
-1.558
-3.17%
jan 1, 1989
48.511
+0.857
1.8%
jan 1, 1990
48.348
-0.164
-0.34%
jan 1, 1991
47.694
-0.653
-1.35%
jan 1, 1992
46.498
-1.196
-2.51%
jan 1, 1993
46.562
+0.064
0.14%
jan 1, 1994
47.13
+0.568
1.22%
jan 1, 1995
46.628
-0.502
-1.07%
jan 1, 1996
47.333
+0.705
1.51%
jan 1, 1997
46.831
-0.502
-1.06%
jan 1, 1998
42.229
-4.602
-9.83%
jan 1, 1999
45.654
+3.425
8.11%
jan 1, 2000
46.777
+1.123
2.46%
jan 1, 2001
46.366
-0.411
-0.88%
jan 1, 2002
45.879
-0.487
-1.05%
jan 1, 2003
44.61
-1.269
-2.77%
jan 1, 2004
44.551
-0.058
-0.13%
jan 1, 2005
43.849
-0.702
-1.58%
jan 1, 2006
43.54
-0.31
-0.71%
jan 1, 2007
43.066
-0.473
-1.09%
jan 1, 2008
45.065
+1.999
4.64%
jan 1, 2009
44.405
-0.661
-1.47%
Ranking of countries by current statistics by years


Comments: