29
/
en
AIzaSyAYiBZKx7MnpbEhh9jyipgxe19OcubqV5w
April 1, 2024
187439
Malaysia
MYS
true
2
1
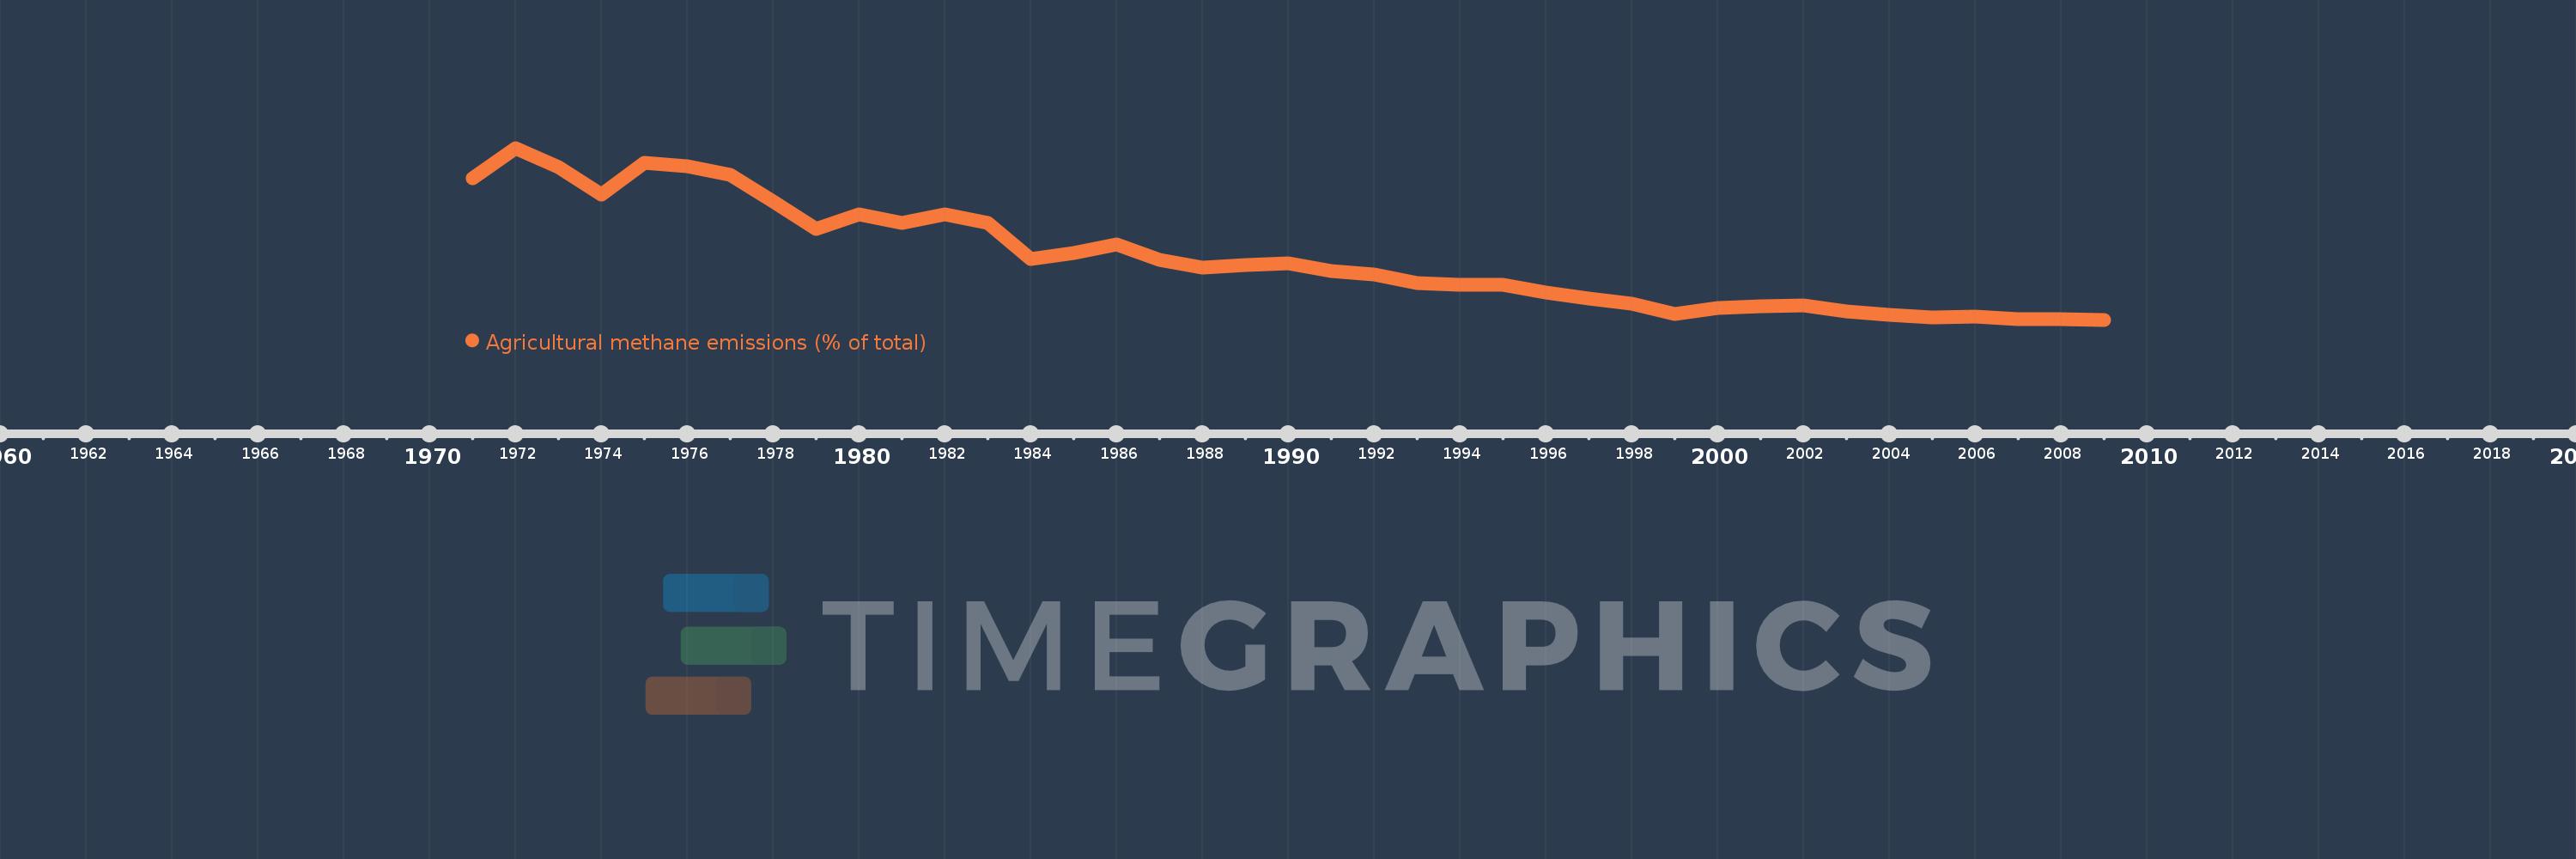
Agricultural methane emissions (% of total)
2009,2008,2007,2006,2005,2004,2003,2002,2001,2000,1999,1998,1997,1996,1995,1994,1993,1992,1991,1990,1989,1988,1987,1986,1985,1984,1983,1982,1981,1980,1979,1978,1977,1976,1975,1974,1973,1972,1971
This statistics in other country:
AfghanistanAlbaniaAlgeriaAmerican SamoaAngolaAntigua and BarbudaArab WorldArgentinaArmeniaArubaAustraliaAustriaAzerbaijanBahamas, TheBahrainBangladeshBarbadosBelarusBelgiumBelizeBeninBermudaBhutanBoliviaBosnia and HerzegovinaBotswanaBrazilBritish Virgin IslandsBrunei DarussalamBulgariaBurkina FasoBurundiCabo VerdeCambodiaCameroonCanadaCaribbean small statesCayman IslandsCentral African RepublicCentral Europe and the BalticsChadChileChinaColombiaComorosCongo, Dem. Rep.Congo, Rep.Costa RicaCote d'IvoireCroatiaCubaCyprusCzech RepublicDenmarkDjiboutiDominicaDominican RepublicEarly-demographic dividendEast Asia & PacificEast Asia & Pacific (excluding high income)East Asia & Pacific (IDA & IBRD countries)EcuadorEgypt, Arab Rep.El SalvadorEquatorial GuineaEritreaEstoniaEthiopiaEuro areaEurope & Central AsiaEurope & Central Asia (excluding high income)Europe & Central Asia (IDA & IBRD countries)European UnionFaroe IslandsFijiFinlandFragile and conflict affected situationsFranceFrench PolynesiaGabonGambia, TheGeorgiaGermanyGhanaGibraltarGreeceGreenlandGrenadaGuamGuatemalaGuineaGuinea-BissauGuyanaHaitiHeavily indebted poor countries (HIPC)High incomeHondurasHong Kong SAR, ChinaHungaryIBRD onlyIcelandIDA & IBRD totalIDA blendIDA onlyIDA totalIndiaIndonesiaIran, Islamic Rep.IraqIrelandIsraelItalyJamaicaJapanJordanKazakhstanKenyaKiribatiKorea, Dem. People’s Rep.Korea, Rep.KuwaitKyrgyz RepublicLao PDRLate-demographic dividendLatin America & Caribbean Latin America & Caribbean (excluding high income)Latin America & the Caribbean (IDA & IBRD countries)LatviaLeast developed countries: UN classificationLebanonLesothoLiberiaLibyaLithuaniaLow & middle incomeLow incomeLower middle incomeLuxembourgMacao SAR, ChinaMacedonia, FYRMadagascarMalawiMalaysiaMaldivesMaliMaltaMarshall IslandsMauritaniaMauritiusMexicoMicronesia, Fed. Sts.Middle East & North AfricaMiddle East & North Africa (excluding high income)Middle East & North Africa (IDA & IBRD countries)Middle incomeMoldovaMongoliaMoroccoMozambiqueMyanmarNamibiaNauruNepalNetherlandsNew CaledoniaNew ZealandNicaraguaNigerNigeriaNorth AmericaNorthern Mariana IslandsNorwayOECD membersOmanOther small statesPacific island small statesPakistanPalauPanamaPapua New GuineaParaguayPeruPhilippinesPolandPortugalPost-demographic dividendPre-demographic dividendPuerto RicoQatarRomaniaRussian FederationRwandaSamoaSao Tome and PrincipeSaudi ArabiaSenegalSerbiaSeychellesSierra LeoneSingaporeSlovak RepublicSloveniaSmall statesSolomon IslandsSomaliaSouth AfricaSouth AsiaSouth Asia (IDA & IBRD)SpainSri LankaSt. Kitts and NevisSt. LuciaSt. Vincent and the GrenadinesSub-Saharan Africa Sub-Saharan Africa (excluding high income)Sub-Saharan Africa (IDA & IBRD countries)SudanSurinameSwazilandSwedenSwitzerlandSyrian Arab RepublicTajikistanTanzaniaThailandTimor-LesteTogoTongaTrinidad and TobagoTunisiaTurkeyTurkmenistanTurks and Caicos IslandsTuvaluUgandaUkraineUnited Arab EmiratesUnited KingdomUnited StatesUpper middle incomeUruguayUzbekistanVanuatuVenezuela, RBVietnamVirgin Islands (U.S.)WorldYemen, Rep.ZambiaZimbabwe Timeline:
This timeline shows a graph from 1971 to 2009 of Malaysia. No data until 1970. Number of actual observations by date: 39.
Source name:
World Development Indicators
Source organization:
World Bank staff estimates from original source: European Commission, Joint Research Centre (JRC)/Netherlands Environmental Assessment Agency (PBL). Emission Database for Global Atmospheric Research (EDGAR): http://edgar.jrc.ec.europa.eu/.
Categories, topics:
Agriculture & Rural Development, Environment
Last updated:
apr 23, 2017
Indicators value changes by year
Minimum:
15.156
jan 1, 2009
Maximum:
64.432
jan 1, 1972
At the date of observation
Value
Absolute change
Change from previous value
jan 1, 1971
55.806
+55.806
0.0%
jan 1, 1972
64.432
+8.626
15.46%
jan 1, 1973
59.044
-5.389
-8.36%
jan 1, 1974
51.13
-7.914
-13.4%
jan 1, 1975
60.15
+9.02
17.64%
jan 1, 1976
59.223
-0.927
-1.54%
jan 1, 1977
56.686
-2.538
-4.29%
jan 1, 1978
49.16
-7.526
-13.28%
jan 1, 1979
41.101
-8.059
-16.39%
jan 1, 1980
45.477
+4.376
10.65%
jan 1, 1981
42.889
-2.587
-5.69%
jan 1, 1982
45.327
+2.438
5.68%
jan 1, 1983
42.943
-2.384
-5.26%
jan 1, 1984
32.545
-10.398
-24.21%
jan 1, 1985
34.42
+1.875
5.76%
jan 1, 1986
36.668
+2.248
6.53%
jan 1, 1987
32.267
-4.401
-12.0%
jan 1, 1988
30.228
-2.039
-6.32%
jan 1, 1989
30.948
+0.72
2.38%
jan 1, 1990
31.362
+0.414
1.34%
jan 1, 1991
29.011
-2.352
-7.5%
jan 1, 1992
28.157
-0.854
-2.94%
jan 1, 1993
25.776
-2.381
-8.46%
jan 1, 1994
25.2
-0.576
-2.23%
jan 1, 1995
25.102
-0.098
-0.39%
jan 1, 1996
22.931
-2.172
-8.65%
jan 1, 1997
21.313
-1.618
-7.06%
jan 1, 1998
19.837
-1.476
-6.93%
jan 1, 1999
16.875
-2.962
-14.93%
jan 1, 2000
18.538
+1.663
9.86%
jan 1, 2001
19.038
+0.5
2.7%
jan 1, 2002
19.278
+0.24
1.26%
jan 1, 2003
17.609
-1.67
-8.66%
jan 1, 2004
16.511
-1.097
-6.23%
jan 1, 2005
15.894
-0.617
-3.73%
jan 1, 2006
15.977
+0.082
0.52%
jan 1, 2007
15.308
-0.669
-4.19%
jan 1, 2008
15.375
+0.068
0.44%
jan 1, 2009
15.156
-0.219
-1.43%
Ranking of countries by current statistics by years


Comments: