29
/
en
AIzaSyAYiBZKx7MnpbEhh9jyipgxe19OcubqV5w
April 1, 2024
201211
Morocco
MAR
true
2
1
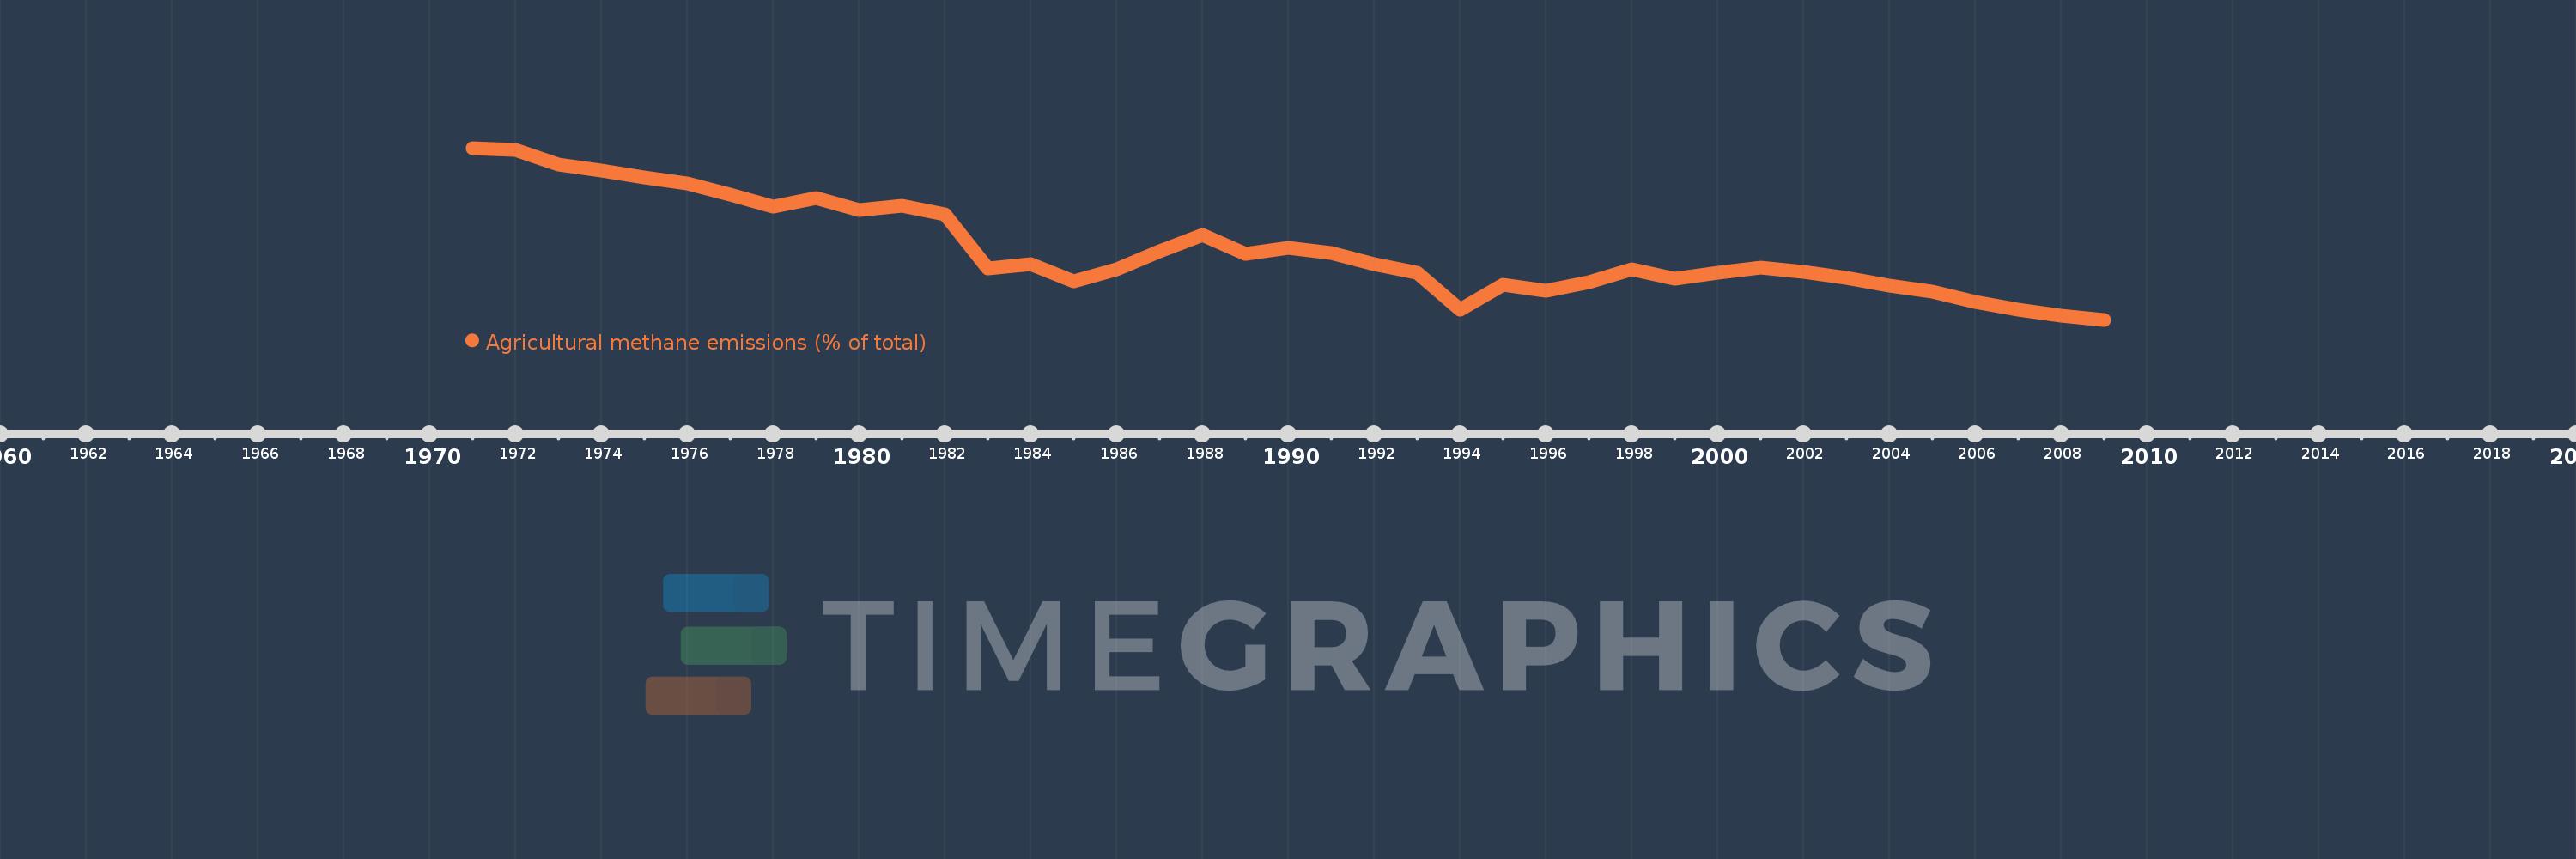
Agricultural methane emissions (% of total)
2009,2008,2007,2006,2005,2004,2003,2002,2001,2000,1999,1998,1997,1996,1995,1994,1993,1992,1991,1990,1989,1988,1987,1986,1985,1984,1983,1982,1981,1980,1979,1978,1977,1976,1975,1974,1973,1972,1971
This statistics in other country:
AfghanistanAlbaniaAlgeriaAmerican SamoaAngolaAntigua and BarbudaArab WorldArgentinaArmeniaArubaAustraliaAustriaAzerbaijanBahamas, TheBahrainBangladeshBarbadosBelarusBelgiumBelizeBeninBermudaBhutanBoliviaBosnia and HerzegovinaBotswanaBrazilBritish Virgin IslandsBrunei DarussalamBulgariaBurkina FasoBurundiCabo VerdeCambodiaCameroonCanadaCaribbean small statesCayman IslandsCentral African RepublicCentral Europe and the BalticsChadChileChinaColombiaComorosCongo, Dem. Rep.Congo, Rep.Costa RicaCote d'IvoireCroatiaCubaCyprusCzech RepublicDenmarkDjiboutiDominicaDominican RepublicEarly-demographic dividendEast Asia & PacificEast Asia & Pacific (excluding high income)East Asia & Pacific (IDA & IBRD countries)EcuadorEgypt, Arab Rep.El SalvadorEquatorial GuineaEritreaEstoniaEthiopiaEuro areaEurope & Central AsiaEurope & Central Asia (excluding high income)Europe & Central Asia (IDA & IBRD countries)European UnionFaroe IslandsFijiFinlandFragile and conflict affected situationsFranceFrench PolynesiaGabonGambia, TheGeorgiaGermanyGhanaGibraltarGreeceGreenlandGrenadaGuamGuatemalaGuineaGuinea-BissauGuyanaHaitiHeavily indebted poor countries (HIPC)High incomeHondurasHong Kong SAR, ChinaHungaryIBRD onlyIcelandIDA & IBRD totalIDA blendIDA onlyIDA totalIndiaIndonesiaIran, Islamic Rep.IraqIrelandIsraelItalyJamaicaJapanJordanKazakhstanKenyaKiribatiKorea, Dem. People’s Rep.Korea, Rep.KuwaitKyrgyz RepublicLao PDRLate-demographic dividendLatin America & Caribbean Latin America & Caribbean (excluding high income)Latin America & the Caribbean (IDA & IBRD countries)LatviaLeast developed countries: UN classificationLebanonLesothoLiberiaLibyaLithuaniaLow & middle incomeLow incomeLower middle incomeLuxembourgMacao SAR, ChinaMacedonia, FYRMadagascarMalawiMalaysiaMaldivesMaliMaltaMarshall IslandsMauritaniaMauritiusMexicoMicronesia, Fed. Sts.Middle East & North AfricaMiddle East & North Africa (excluding high income)Middle East & North Africa (IDA & IBRD countries)Middle incomeMoldovaMongoliaMoroccoMozambiqueMyanmarNamibiaNauruNepalNetherlandsNew CaledoniaNew ZealandNicaraguaNigerNigeriaNorth AmericaNorthern Mariana IslandsNorwayOECD membersOmanOther small statesPacific island small statesPakistanPalauPanamaPapua New GuineaParaguayPeruPhilippinesPolandPortugalPost-demographic dividendPre-demographic dividendPuerto RicoQatarRomaniaRussian FederationRwandaSamoaSao Tome and PrincipeSaudi ArabiaSenegalSerbiaSeychellesSierra LeoneSingaporeSlovak RepublicSloveniaSmall statesSolomon IslandsSomaliaSouth AfricaSouth AsiaSouth Asia (IDA & IBRD)SpainSri LankaSt. Kitts and NevisSt. LuciaSt. Vincent and the GrenadinesSub-Saharan Africa Sub-Saharan Africa (excluding high income)Sub-Saharan Africa (IDA & IBRD countries)SudanSurinameSwazilandSwedenSwitzerlandSyrian Arab RepublicTajikistanTanzaniaThailandTimor-LesteTogoTongaTrinidad and TobagoTunisiaTurkeyTurkmenistanTurks and Caicos IslandsTuvaluUgandaUkraineUnited Arab EmiratesUnited KingdomUnited StatesUpper middle incomeUruguayUzbekistanVanuatuVenezuela, RBVietnamVirgin Islands (U.S.)WorldYemen, Rep.ZambiaZimbabwe Timeline:
This timeline shows a graph from 1971 to 2009 of Morocco. No data until 1970. Number of actual observations by date: 39.
Source name:
World Development Indicators
Source organization:
World Bank staff estimates from original source: European Commission, Joint Research Centre (JRC)/Netherlands Environmental Assessment Agency (PBL). Emission Database for Global Atmospheric Research (EDGAR): http://edgar.jrc.ec.europa.eu/.
Categories, topics:
Agriculture & Rural Development, Environment
Last updated:
apr 23, 2017
Indicators value changes by year
Maximum:
72.178
jan 1, 1971
At the date of observation
Value
Absolute change
Change from previous value
jan 1, 1971
72.178
+72.178
0.0%
jan 1, 1972
71.915
-0.263
-0.36%
jan 1, 1973
70.004
-1.91
-2.66%
jan 1, 1974
69.191
-0.813
-1.16%
jan 1, 1975
68.27
-0.921
-1.33%
jan 1, 1976
67.449
-0.821
-1.2%
jan 1, 1977
65.942
-1.507
-2.23%
jan 1, 1978
64.334
-1.608
-2.44%
jan 1, 1979
65.467
+1.134
1.76%
jan 1, 1980
63.871
-1.597
-2.44%
jan 1, 1981
64.512
+0.641
1.0%
jan 1, 1982
63.304
-1.208
-1.87%
jan 1, 1983
56.081
-7.224
-11.41%
jan 1, 1984
56.748
+0.668
1.19%
jan 1, 1985
54.371
-2.377
-4.19%
jan 1, 1986
56.025
+1.653
3.04%
jan 1, 1987
58.361
+2.336
4.17%
jan 1, 1988
60.617
+2.256
3.87%
jan 1, 1989
58.021
-2.596
-4.28%
jan 1, 1990
58.819
+0.798
1.38%
jan 1, 1991
58.212
-0.606
-1.03%
jan 1, 1992
56.746
-1.466
-2.52%
jan 1, 1993
55.589
-1.157
-2.04%
jan 1, 1994
50.635
-4.955
-8.91%
jan 1, 1995
53.917
+3.283
6.48%
jan 1, 1996
53.092
-0.826
-1.53%
jan 1, 1997
54.288
+1.197
2.25%
jan 1, 1998
56.05
+1.762
3.24%
jan 1, 1999
54.718
-1.332
-2.38%
jan 1, 2000
55.554
+0.836
1.53%
jan 1, 2001
56.259
+0.705
1.27%
jan 1, 2002
55.628
-0.631
-1.12%
jan 1, 2003
54.82
-0.809
-1.45%
jan 1, 2004
53.87
-0.949
-1.73%
jan 1, 2005
52.996
-0.874
-1.62%
jan 1, 2006
51.616
-1.38
-2.6%
jan 1, 2007
50.662
-0.954
-1.85%
jan 1, 2008
49.831
-0.831
-1.64%
jan 1, 2009
49.29
-0.541
-1.09%
Ranking of countries by current statistics by years


Comments: