29
/
en
AIzaSyAYiBZKx7MnpbEhh9jyipgxe19OcubqV5w
April 1, 2024
225599
Portugal
PRT
true
2
1
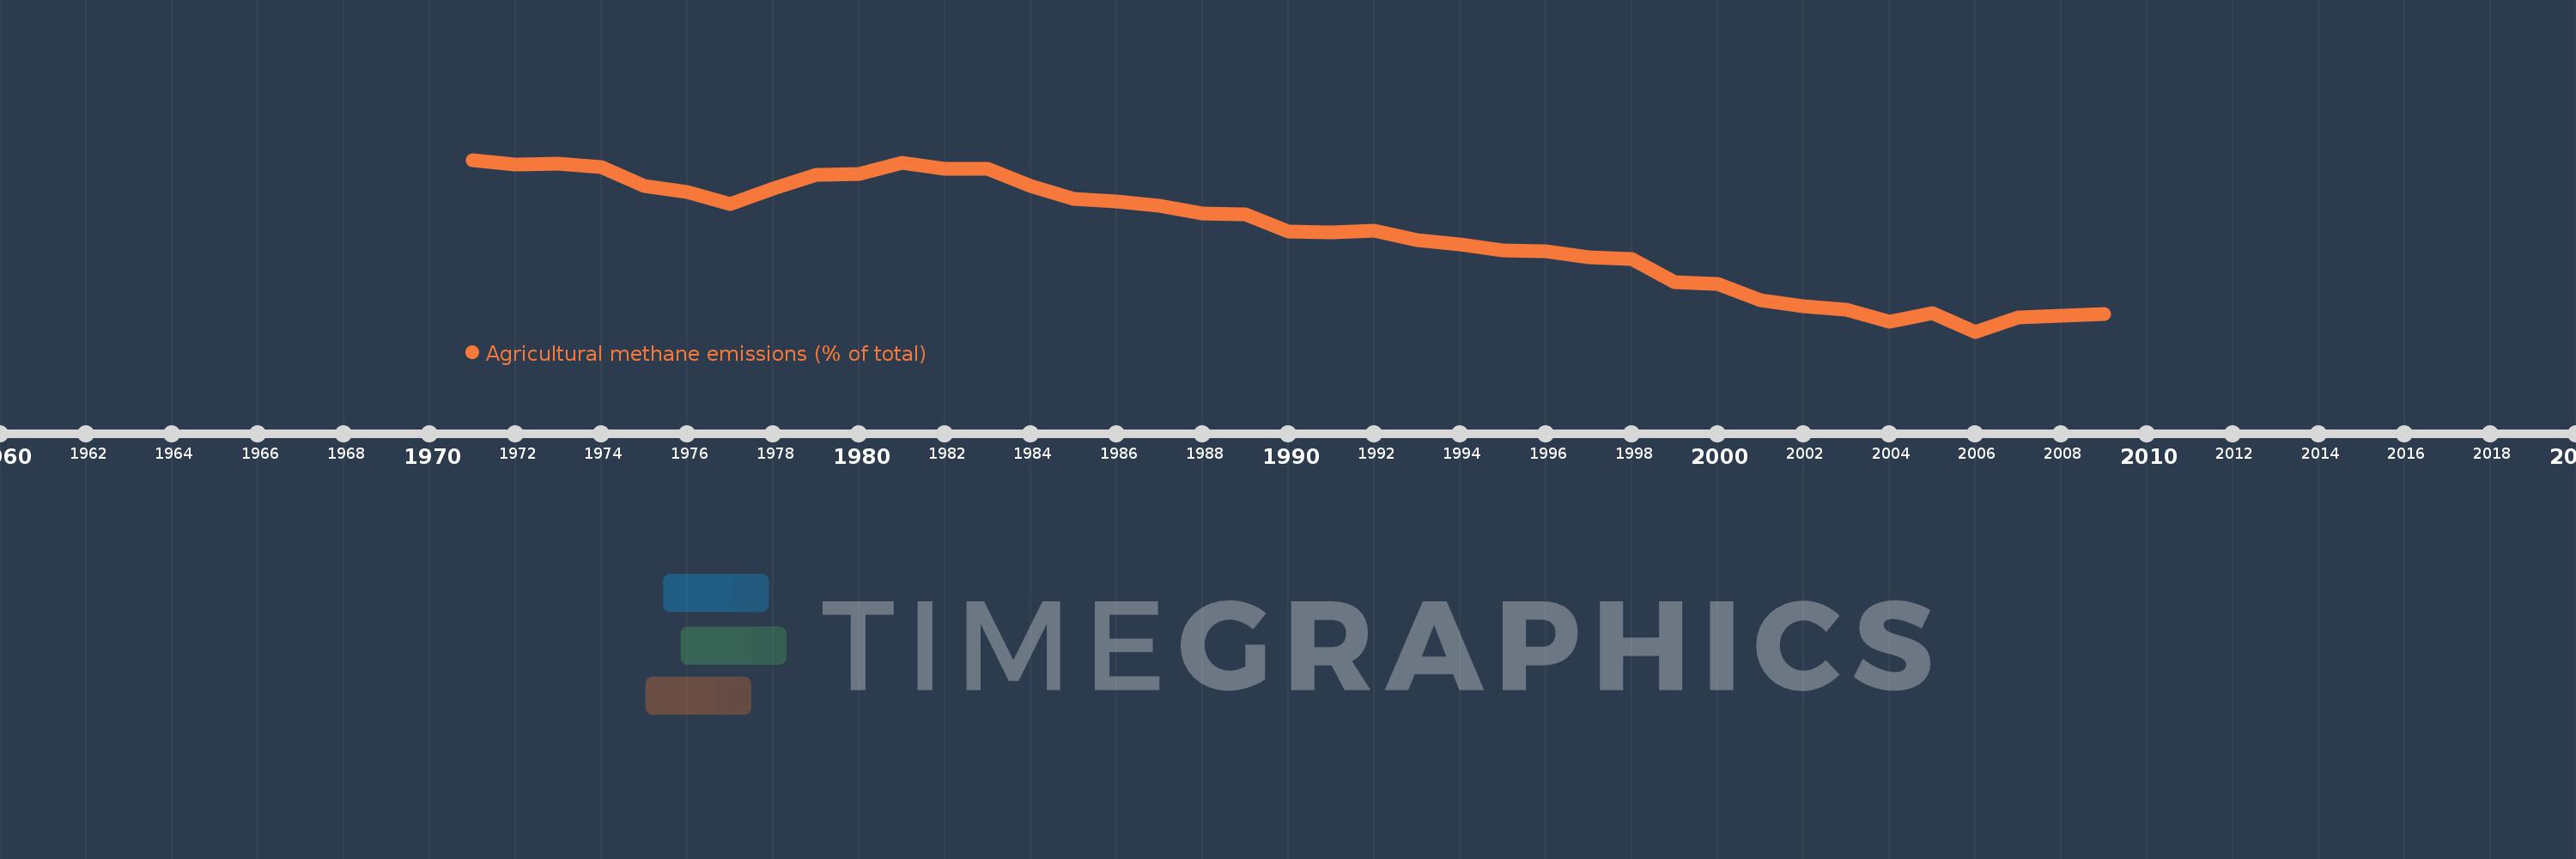
Agricultural methane emissions (% of total)
2009,2008,2007,2006,2005,2004,2003,2002,2001,2000,1999,1998,1997,1996,1995,1994,1993,1992,1991,1990,1989,1988,1987,1986,1985,1984,1983,1982,1981,1980,1979,1978,1977,1976,1975,1974,1973,1972,1971
This statistics in other country:
AfghanistanAlbaniaAlgeriaAmerican SamoaAngolaAntigua and BarbudaArab WorldArgentinaArmeniaArubaAustraliaAustriaAzerbaijanBahamas, TheBahrainBangladeshBarbadosBelarusBelgiumBelizeBeninBermudaBhutanBoliviaBosnia and HerzegovinaBotswanaBrazilBritish Virgin IslandsBrunei DarussalamBulgariaBurkina FasoBurundiCabo VerdeCambodiaCameroonCanadaCaribbean small statesCayman IslandsCentral African RepublicCentral Europe and the BalticsChadChileChinaColombiaComorosCongo, Dem. Rep.Congo, Rep.Costa RicaCote d'IvoireCroatiaCubaCyprusCzech RepublicDenmarkDjiboutiDominicaDominican RepublicEarly-demographic dividendEast Asia & PacificEast Asia & Pacific (excluding high income)East Asia & Pacific (IDA & IBRD countries)EcuadorEgypt, Arab Rep.El SalvadorEquatorial GuineaEritreaEstoniaEthiopiaEuro areaEurope & Central AsiaEurope & Central Asia (excluding high income)Europe & Central Asia (IDA & IBRD countries)European UnionFaroe IslandsFijiFinlandFragile and conflict affected situationsFranceFrench PolynesiaGabonGambia, TheGeorgiaGermanyGhanaGibraltarGreeceGreenlandGrenadaGuamGuatemalaGuineaGuinea-BissauGuyanaHaitiHeavily indebted poor countries (HIPC)High incomeHondurasHong Kong SAR, ChinaHungaryIBRD onlyIcelandIDA & IBRD totalIDA blendIDA onlyIDA totalIndiaIndonesiaIran, Islamic Rep.IraqIrelandIsraelItalyJamaicaJapanJordanKazakhstanKenyaKiribatiKorea, Dem. People’s Rep.Korea, Rep.KuwaitKyrgyz RepublicLao PDRLate-demographic dividendLatin America & Caribbean Latin America & Caribbean (excluding high income)Latin America & the Caribbean (IDA & IBRD countries)LatviaLeast developed countries: UN classificationLebanonLesothoLiberiaLibyaLithuaniaLow & middle incomeLow incomeLower middle incomeLuxembourgMacao SAR, ChinaMacedonia, FYRMadagascarMalawiMalaysiaMaldivesMaliMaltaMarshall IslandsMauritaniaMauritiusMexicoMicronesia, Fed. Sts.Middle East & North AfricaMiddle East & North Africa (excluding high income)Middle East & North Africa (IDA & IBRD countries)Middle incomeMoldovaMongoliaMoroccoMozambiqueMyanmarNamibiaNauruNepalNetherlandsNew CaledoniaNew ZealandNicaraguaNigerNigeriaNorth AmericaNorthern Mariana IslandsNorwayOECD membersOmanOther small statesPacific island small statesPakistanPalauPanamaPapua New GuineaParaguayPeruPhilippinesPolandPortugalPost-demographic dividendPre-demographic dividendPuerto RicoQatarRomaniaRussian FederationRwandaSamoaSao Tome and PrincipeSaudi ArabiaSenegalSerbiaSeychellesSierra LeoneSingaporeSlovak RepublicSloveniaSmall statesSolomon IslandsSomaliaSouth AfricaSouth AsiaSouth Asia (IDA & IBRD)SpainSri LankaSt. Kitts and NevisSt. LuciaSt. Vincent and the GrenadinesSub-Saharan Africa Sub-Saharan Africa (excluding high income)Sub-Saharan Africa (IDA & IBRD countries)SudanSurinameSwazilandSwedenSwitzerlandSyrian Arab RepublicTajikistanTanzaniaThailandTimor-LesteTogoTongaTrinidad and TobagoTunisiaTurkeyTurkmenistanTurks and Caicos IslandsTuvaluUgandaUkraineUnited Arab EmiratesUnited KingdomUnited StatesUpper middle incomeUruguayUzbekistanVanuatuVenezuela, RBVietnamVirgin Islands (U.S.)WorldYemen, Rep.ZambiaZimbabwe Timeline:
This timeline shows a graph from 1971 to 2009 of Portugal. No data until 1970. Number of actual observations by date: 39.
Source name:
World Development Indicators
Source organization:
World Bank staff estimates from original source: European Commission, Joint Research Centre (JRC)/Netherlands Environmental Assessment Agency (PBL). Emission Database for Global Atmospheric Research (EDGAR): http://edgar.jrc.ec.europa.eu/.
Categories, topics:
Agriculture & Rural Development, Environment
Last updated:
apr 23, 2017
Indicators value changes by year
Minimum:
31.567
jan 1, 2006
Maximum:
52.775
jan 1, 1971
At the date of observation
Value
Absolute change
Change from previous value
jan 1, 1971
52.775
+52.775
0.0%
jan 1, 1972
52.196
-0.579
-1.1%
jan 1, 1973
52.318
+0.122
0.23%
jan 1, 1974
51.877
-0.441
-0.84%
jan 1, 1975
49.526
-2.351
-4.53%
jan 1, 1976
48.822
-0.704
-1.42%
jan 1, 1977
47.315
-1.507
-3.09%
jan 1, 1978
49.17
+1.855
3.92%
jan 1, 1979
50.971
+1.801
3.66%
jan 1, 1980
51.034
+0.063
0.12%
jan 1, 1981
52.354
+1.32
2.59%
jan 1, 1982
51.62
-0.734
-1.4%
jan 1, 1983
51.637
+0.017
0.03%
jan 1, 1984
49.56
-2.076
-4.02%
jan 1, 1985
47.998
-1.562
-3.15%
jan 1, 1986
47.597
-0.402
-0.84%
jan 1, 1987
47.061
-0.536
-1.13%
jan 1, 1988
46.144
-0.917
-1.95%
jan 1, 1989
45.999
-0.145
-0.31%
jan 1, 1990
43.871
-2.128
-4.63%
jan 1, 1991
43.83
-0.041
-0.09%
jan 1, 1992
44.024
+0.194
0.44%
jan 1, 1993
42.858
-1.166
-2.65%
jan 1, 1994
42.31
-0.548
-1.28%
jan 1, 1995
41.573
-0.737
-1.74%
jan 1, 1996
41.429
-0.144
-0.35%
jan 1, 1997
40.755
-0.674
-1.63%
jan 1, 1998
40.519
-0.237
-0.58%
jan 1, 1999
37.701
-2.817
-6.95%
jan 1, 2000
37.466
-0.235
-0.62%
jan 1, 2001
35.444
-2.022
-5.4%
jan 1, 2002
34.647
-0.797
-2.25%
jan 1, 2003
34.235
-0.412
-1.19%
jan 1, 2004
32.79
-1.446
-4.22%
jan 1, 2005
33.844
+1.055
3.22%
jan 1, 2006
31.567
-2.277
-6.73%
jan 1, 2007
33.291
+1.723
5.46%
jan 1, 2008
33.576
+0.286
0.86%
jan 1, 2009
33.755
+0.179
0.53%
Ranking of countries by current statistics by years


Comments: