29
/
en
AIzaSyAYiBZKx7MnpbEhh9jyipgxe19OcubqV5w
April 1, 2024
108233
Comoros
COM
true
2
1
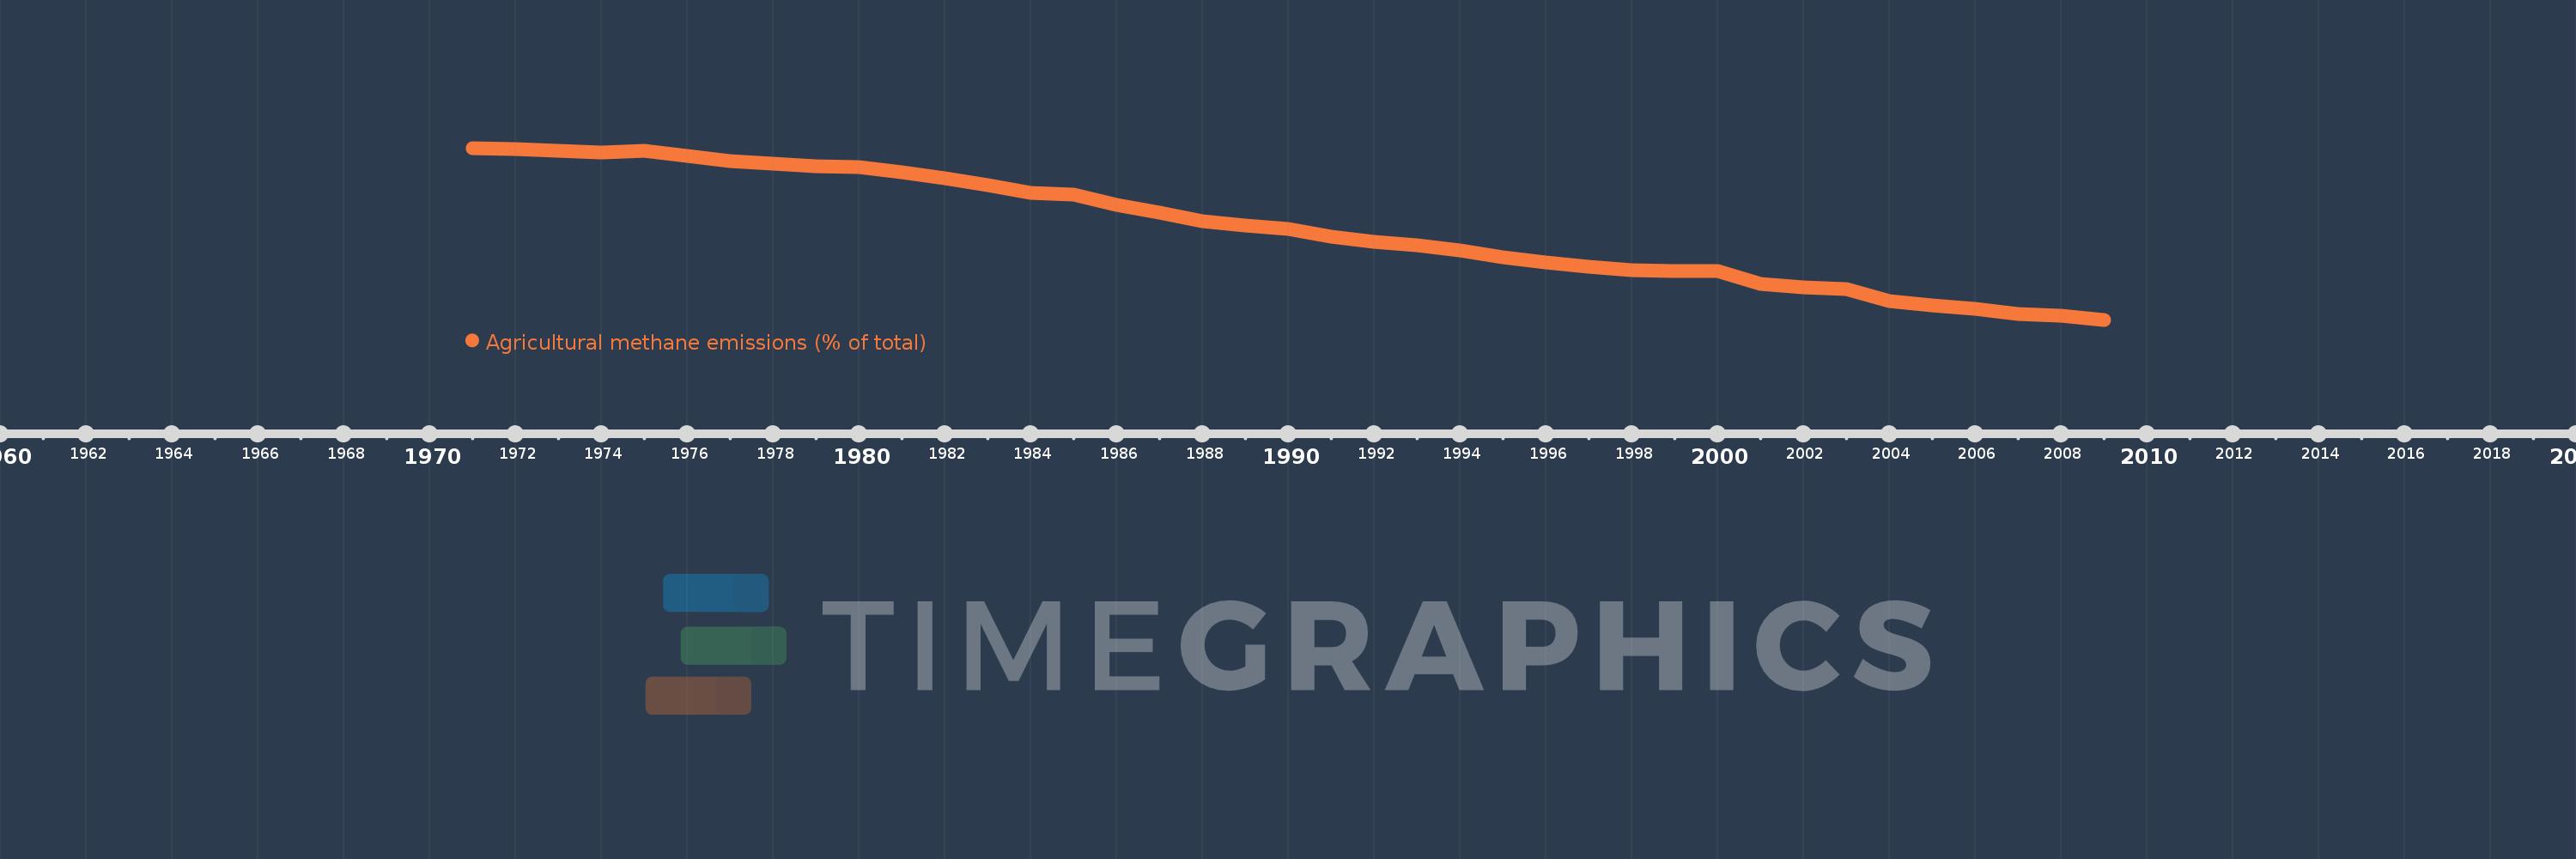
Agricultural methane emissions (% of total)
2009,2008,2007,2006,2005,2004,2003,2002,2001,2000,1999,1998,1997,1996,1995,1994,1993,1992,1991,1990,1989,1988,1987,1986,1985,1984,1983,1982,1981,1980,1979,1978,1977,1976,1975,1974,1973,1972,1971
This statistics in other country:
AfghanistanAlbaniaAlgeriaAmerican SamoaAngolaAntigua and BarbudaArab WorldArgentinaArmeniaArubaAustraliaAustriaAzerbaijanBahamas, TheBahrainBangladeshBarbadosBelarusBelgiumBelizeBeninBermudaBhutanBoliviaBosnia and HerzegovinaBotswanaBrazilBritish Virgin IslandsBrunei DarussalamBulgariaBurkina FasoBurundiCabo VerdeCambodiaCameroonCanadaCaribbean small statesCayman IslandsCentral African RepublicCentral Europe and the BalticsChadChileChinaColombiaComorosCongo, Dem. Rep.Congo, Rep.Costa RicaCote d'IvoireCroatiaCubaCyprusCzech RepublicDenmarkDjiboutiDominicaDominican RepublicEarly-demographic dividendEast Asia & PacificEast Asia & Pacific (excluding high income)East Asia & Pacific (IDA & IBRD countries)EcuadorEgypt, Arab Rep.El SalvadorEquatorial GuineaEritreaEstoniaEthiopiaEuro areaEurope & Central AsiaEurope & Central Asia (excluding high income)Europe & Central Asia (IDA & IBRD countries)European UnionFaroe IslandsFijiFinlandFragile and conflict affected situationsFranceFrench PolynesiaGabonGambia, TheGeorgiaGermanyGhanaGibraltarGreeceGreenlandGrenadaGuamGuatemalaGuineaGuinea-BissauGuyanaHaitiHeavily indebted poor countries (HIPC)High incomeHondurasHong Kong SAR, ChinaHungaryIBRD onlyIcelandIDA & IBRD totalIDA blendIDA onlyIDA totalIndiaIndonesiaIran, Islamic Rep.IraqIrelandIsraelItalyJamaicaJapanJordanKazakhstanKenyaKiribatiKorea, Dem. People’s Rep.Korea, Rep.KuwaitKyrgyz RepublicLao PDRLate-demographic dividendLatin America & Caribbean Latin America & Caribbean (excluding high income)Latin America & the Caribbean (IDA & IBRD countries)LatviaLeast developed countries: UN classificationLebanonLesothoLiberiaLibyaLithuaniaLow & middle incomeLow incomeLower middle incomeLuxembourgMacao SAR, ChinaMacedonia, FYRMadagascarMalawiMalaysiaMaldivesMaliMaltaMarshall IslandsMauritaniaMauritiusMexicoMicronesia, Fed. Sts.Middle East & North AfricaMiddle East & North Africa (excluding high income)Middle East & North Africa (IDA & IBRD countries)Middle incomeMoldovaMongoliaMoroccoMozambiqueMyanmarNamibiaNauruNepalNetherlandsNew CaledoniaNew ZealandNicaraguaNigerNigeriaNorth AmericaNorthern Mariana IslandsNorwayOECD membersOmanOther small statesPacific island small statesPakistanPalauPanamaPapua New GuineaParaguayPeruPhilippinesPolandPortugalPost-demographic dividendPre-demographic dividendPuerto RicoQatarRomaniaRussian FederationRwandaSamoaSao Tome and PrincipeSaudi ArabiaSenegalSerbiaSeychellesSierra LeoneSingaporeSlovak RepublicSloveniaSmall statesSolomon IslandsSomaliaSouth AfricaSouth AsiaSouth Asia (IDA & IBRD)SpainSri LankaSt. Kitts and NevisSt. LuciaSt. Vincent and the GrenadinesSub-Saharan Africa Sub-Saharan Africa (excluding high income)Sub-Saharan Africa (IDA & IBRD countries)SudanSurinameSwazilandSwedenSwitzerlandSyrian Arab RepublicTajikistanTanzaniaThailandTimor-LesteTogoTongaTrinidad and TobagoTunisiaTurkeyTurkmenistanTurks and Caicos IslandsTuvaluUgandaUkraineUnited Arab EmiratesUnited KingdomUnited StatesUpper middle incomeUruguayUzbekistanVanuatuVenezuela, RBVietnamVirgin Islands (U.S.)WorldYemen, Rep.ZambiaZimbabwe Timeline:
This timeline shows a graph from 1971 to 2009 of Comoros. No data until 1970. Number of actual observations by date: 39.
Source name:
World Development Indicators
Source organization:
World Bank staff estimates from original source: European Commission, Joint Research Centre (JRC)/Netherlands Environmental Assessment Agency (PBL). Emission Database for Global Atmospheric Research (EDGAR): http://edgar.jrc.ec.europa.eu/.
Categories, topics:
Agriculture & Rural Development, Environment
Last updated:
apr 23, 2017
Indicators value changes by year
Minimum:
32.704
jan 1, 2009
Maximum:
66.774
jan 1, 1971
At the date of observation
Value
Absolute change
Change from previous value
jan 1, 1971
66.774
+66.774
0.0%
jan 1, 1972
66.57
-0.204
-0.3%
jan 1, 1973
66.187
-0.383
-0.58%
jan 1, 1974
65.927
-0.26
-0.39%
jan 1, 1975
66.175
+0.248
0.38%
jan 1, 1976
65.149
-1.026
-1.55%
jan 1, 1977
64.176
-0.973
-1.49%
jan 1, 1978
63.646
-0.531
-0.83%
jan 1, 1979
63.153
-0.493
-0.77%
jan 1, 1980
62.994
-0.158
-0.25%
jan 1, 1981
61.884
-1.11
-1.76%
jan 1, 1982
60.711
-1.173
-1.9%
jan 1, 1983
59.464
-1.246
-2.05%
jan 1, 1984
57.92
-1.545
-2.6%
jan 1, 1985
57.473
-0.447
-0.77%
jan 1, 1986
55.502
-1.971
-3.43%
jan 1, 1987
53.972
-1.53
-2.76%
jan 1, 1988
52.172
-1.8
-3.33%
jan 1, 1989
51.439
-0.733
-1.4%
jan 1, 1990
50.719
-0.72
-1.4%
jan 1, 1991
49.178
-1.542
-3.04%
jan 1, 1992
48.17
-1.008
-2.05%
jan 1, 1993
47.422
-0.748
-1.55%
jan 1, 1994
46.377
-1.044
-2.2%
jan 1, 1995
45.146
-1.231
-2.66%
jan 1, 1996
44.115
-1.031
-2.28%
jan 1, 1997
43.178
-0.937
-2.12%
jan 1, 1998
42.483
-0.695
-1.61%
jan 1, 1999
42.368
-0.115
-0.27%
jan 1, 2000
42.282
-0.087
-0.2%
jan 1, 2001
39.867
-2.414
-5.71%
jan 1, 2002
39.19
-0.678
-1.7%
jan 1, 2003
38.849
-0.341
-0.87%
jan 1, 2004
36.439
-2.409
-6.2%
jan 1, 2005
35.614
-0.825
-2.26%
jan 1, 2006
34.897
-0.717
-2.01%
jan 1, 2007
33.894
-1.003
-2.87%
jan 1, 2008
33.422
-0.472
-1.39%
jan 1, 2009
32.704
-0.718
-2.15%
Ranking of countries by current statistics by years


Comments: