29
/
en
AIzaSyAYiBZKx7MnpbEhh9jyipgxe19OcubqV5w
April 1, 2024
155569
Indonesia
IDN
true
2
1
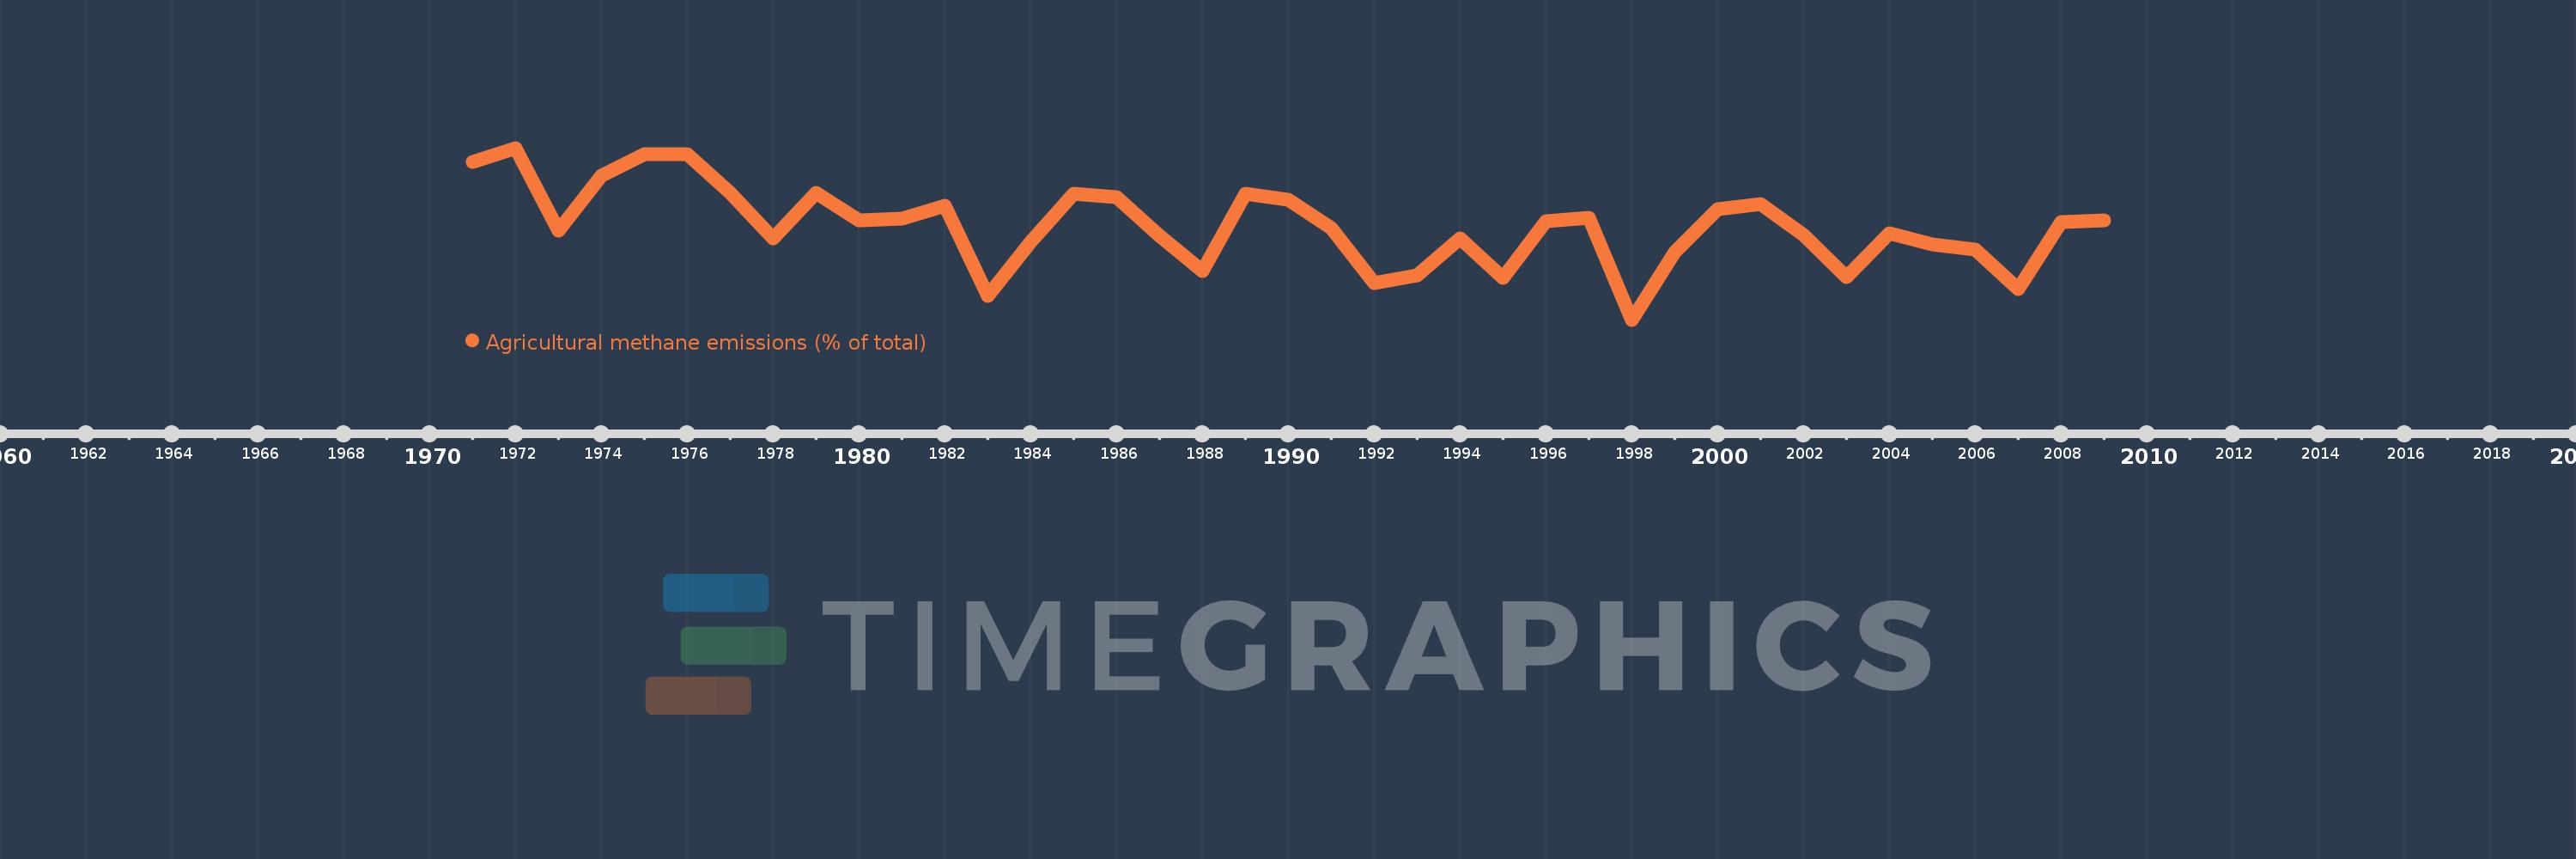
Agricultural methane emissions (% of total)
2009,2008,2007,2006,2005,2004,2003,2002,2001,2000,1999,1998,1997,1996,1995,1994,1993,1992,1991,1990,1989,1988,1987,1986,1985,1984,1983,1982,1981,1980,1979,1978,1977,1976,1975,1974,1973,1972,1971
This statistics in other country:
AfghanistanAlbaniaAlgeriaAmerican SamoaAngolaAntigua and BarbudaArab WorldArgentinaArmeniaArubaAustraliaAustriaAzerbaijanBahamas, TheBahrainBangladeshBarbadosBelarusBelgiumBelizeBeninBermudaBhutanBoliviaBosnia and HerzegovinaBotswanaBrazilBritish Virgin IslandsBrunei DarussalamBulgariaBurkina FasoBurundiCabo VerdeCambodiaCameroonCanadaCaribbean small statesCayman IslandsCentral African RepublicCentral Europe and the BalticsChadChileChinaColombiaComorosCongo, Dem. Rep.Congo, Rep.Costa RicaCote d'IvoireCroatiaCubaCyprusCzech RepublicDenmarkDjiboutiDominicaDominican RepublicEarly-demographic dividendEast Asia & PacificEast Asia & Pacific (excluding high income)East Asia & Pacific (IDA & IBRD countries)EcuadorEgypt, Arab Rep.El SalvadorEquatorial GuineaEritreaEstoniaEthiopiaEuro areaEurope & Central AsiaEurope & Central Asia (excluding high income)Europe & Central Asia (IDA & IBRD countries)European UnionFaroe IslandsFijiFinlandFragile and conflict affected situationsFranceFrench PolynesiaGabonGambia, TheGeorgiaGermanyGhanaGibraltarGreeceGreenlandGrenadaGuamGuatemalaGuineaGuinea-BissauGuyanaHaitiHeavily indebted poor countries (HIPC)High incomeHondurasHong Kong SAR, ChinaHungaryIBRD onlyIcelandIDA & IBRD totalIDA blendIDA onlyIDA totalIndiaIndonesiaIran, Islamic Rep.IraqIrelandIsraelItalyJamaicaJapanJordanKazakhstanKenyaKiribatiKorea, Dem. People’s Rep.Korea, Rep.KuwaitKyrgyz RepublicLao PDRLate-demographic dividendLatin America & Caribbean Latin America & Caribbean (excluding high income)Latin America & the Caribbean (IDA & IBRD countries)LatviaLeast developed countries: UN classificationLebanonLesothoLiberiaLibyaLithuaniaLow & middle incomeLow incomeLower middle incomeLuxembourgMacao SAR, ChinaMacedonia, FYRMadagascarMalawiMalaysiaMaldivesMaliMaltaMarshall IslandsMauritaniaMauritiusMexicoMicronesia, Fed. Sts.Middle East & North AfricaMiddle East & North Africa (excluding high income)Middle East & North Africa (IDA & IBRD countries)Middle incomeMoldovaMongoliaMoroccoMozambiqueMyanmarNamibiaNauruNepalNetherlandsNew CaledoniaNew ZealandNicaraguaNigerNigeriaNorth AmericaNorthern Mariana IslandsNorwayOECD membersOmanOther small statesPacific island small statesPakistanPalauPanamaPapua New GuineaParaguayPeruPhilippinesPolandPortugalPost-demographic dividendPre-demographic dividendPuerto RicoQatarRomaniaRussian FederationRwandaSamoaSao Tome and PrincipeSaudi ArabiaSenegalSerbiaSeychellesSierra LeoneSingaporeSlovak RepublicSloveniaSmall statesSolomon IslandsSomaliaSouth AfricaSouth AsiaSouth Asia (IDA & IBRD)SpainSri LankaSt. Kitts and NevisSt. LuciaSt. Vincent and the GrenadinesSub-Saharan Africa Sub-Saharan Africa (excluding high income)Sub-Saharan Africa (IDA & IBRD countries)SudanSurinameSwazilandSwedenSwitzerlandSyrian Arab RepublicTajikistanTanzaniaThailandTimor-LesteTogoTongaTrinidad and TobagoTunisiaTurkeyTurkmenistanTurks and Caicos IslandsTuvaluUgandaUkraineUnited Arab EmiratesUnited KingdomUnited StatesUpper middle incomeUruguayUzbekistanVanuatuVenezuela, RBVietnamVirgin Islands (U.S.)WorldYemen, Rep.ZambiaZimbabwe Timeline:
This timeline shows a graph from 1971 to 2009 of Indonesia. No data until 1970. Number of actual observations by date: 39.
Source name:
World Development Indicators
Source organization:
World Bank staff estimates from original source: European Commission, Joint Research Centre (JRC)/Netherlands Environmental Assessment Agency (PBL). Emission Database for Global Atmospheric Research (EDGAR): http://edgar.jrc.ec.europa.eu/.
Categories, topics:
Agriculture & Rural Development, Environment
Last updated:
apr 23, 2017
Indicators value changes by year
Minimum:
10.021
jan 1, 1998
Maximum:
63.935
jan 1, 1972
At the date of observation
Value
Absolute change
Change from previous value
jan 1, 1971
59.418
+59.418
0.0%
jan 1, 1972
63.935
+4.517
7.6%
jan 1, 1973
37.994
-25.942
-40.57%
jan 1, 1974
55.344
+17.35
45.67%
jan 1, 1975
61.878
+6.534
11.81%
jan 1, 1976
61.961
+0.083
0.13%
jan 1, 1977
49.931
-12.03
-19.42%
jan 1, 1978
35.673
-14.258
-28.56%
jan 1, 1979
49.92
+14.247
39.94%
jan 1, 1980
41.1
-8.82
-17.67%
jan 1, 1981
41.838
+0.738
1.8%
jan 1, 1982
45.818
+3.98
9.51%
jan 1, 1983
17.472
-28.346
-61.87%
jan 1, 1984
34.586
+17.115
97.96%
jan 1, 1985
49.52
+14.934
43.18%
jan 1, 1986
48.385
-1.135
-2.29%
jan 1, 1987
36.448
-11.937
-24.67%
jan 1, 1988
25.409
-11.039
-30.29%
jan 1, 1989
49.623
+24.214
95.3%
jan 1, 1990
47.63
-1.993
-4.02%
jan 1, 1991
38.769
-8.861
-18.6%
jan 1, 1992
21.489
-17.28
-44.57%
jan 1, 1993
23.987
+2.498
11.62%
jan 1, 1994
35.667
+11.68
48.69%
jan 1, 1995
23.194
-12.473
-34.97%
jan 1, 1996
41.047
+17.853
76.97%
jan 1, 1997
41.991
+0.944
2.3%
jan 1, 1998
10.021
-31.97
-76.14%
jan 1, 1999
31.284
+21.263
212.19%
jan 1, 2000
44.618
+13.334
42.62%
jan 1, 2001
46.386
+1.769
3.96%
jan 1, 2002
36.549
-9.838
-21.21%
jan 1, 2003
23.377
-13.172
-36.04%
jan 1, 2004
37.101
+13.723
58.7%
jan 1, 2005
33.795
-3.306
-8.91%
jan 1, 2006
31.979
-1.816
-5.37%
jan 1, 2007
19.694
-12.285
-38.42%
jan 1, 2008
40.61
+20.916
106.2%
jan 1, 2009
41.134
+0.524
1.29%
Ranking of countries by current statistics by years


Comments: