29
/
en
AIzaSyAYiBZKx7MnpbEhh9jyipgxe19OcubqV5w
April 1, 2024
142486
Greenland
GRL
true
2
1
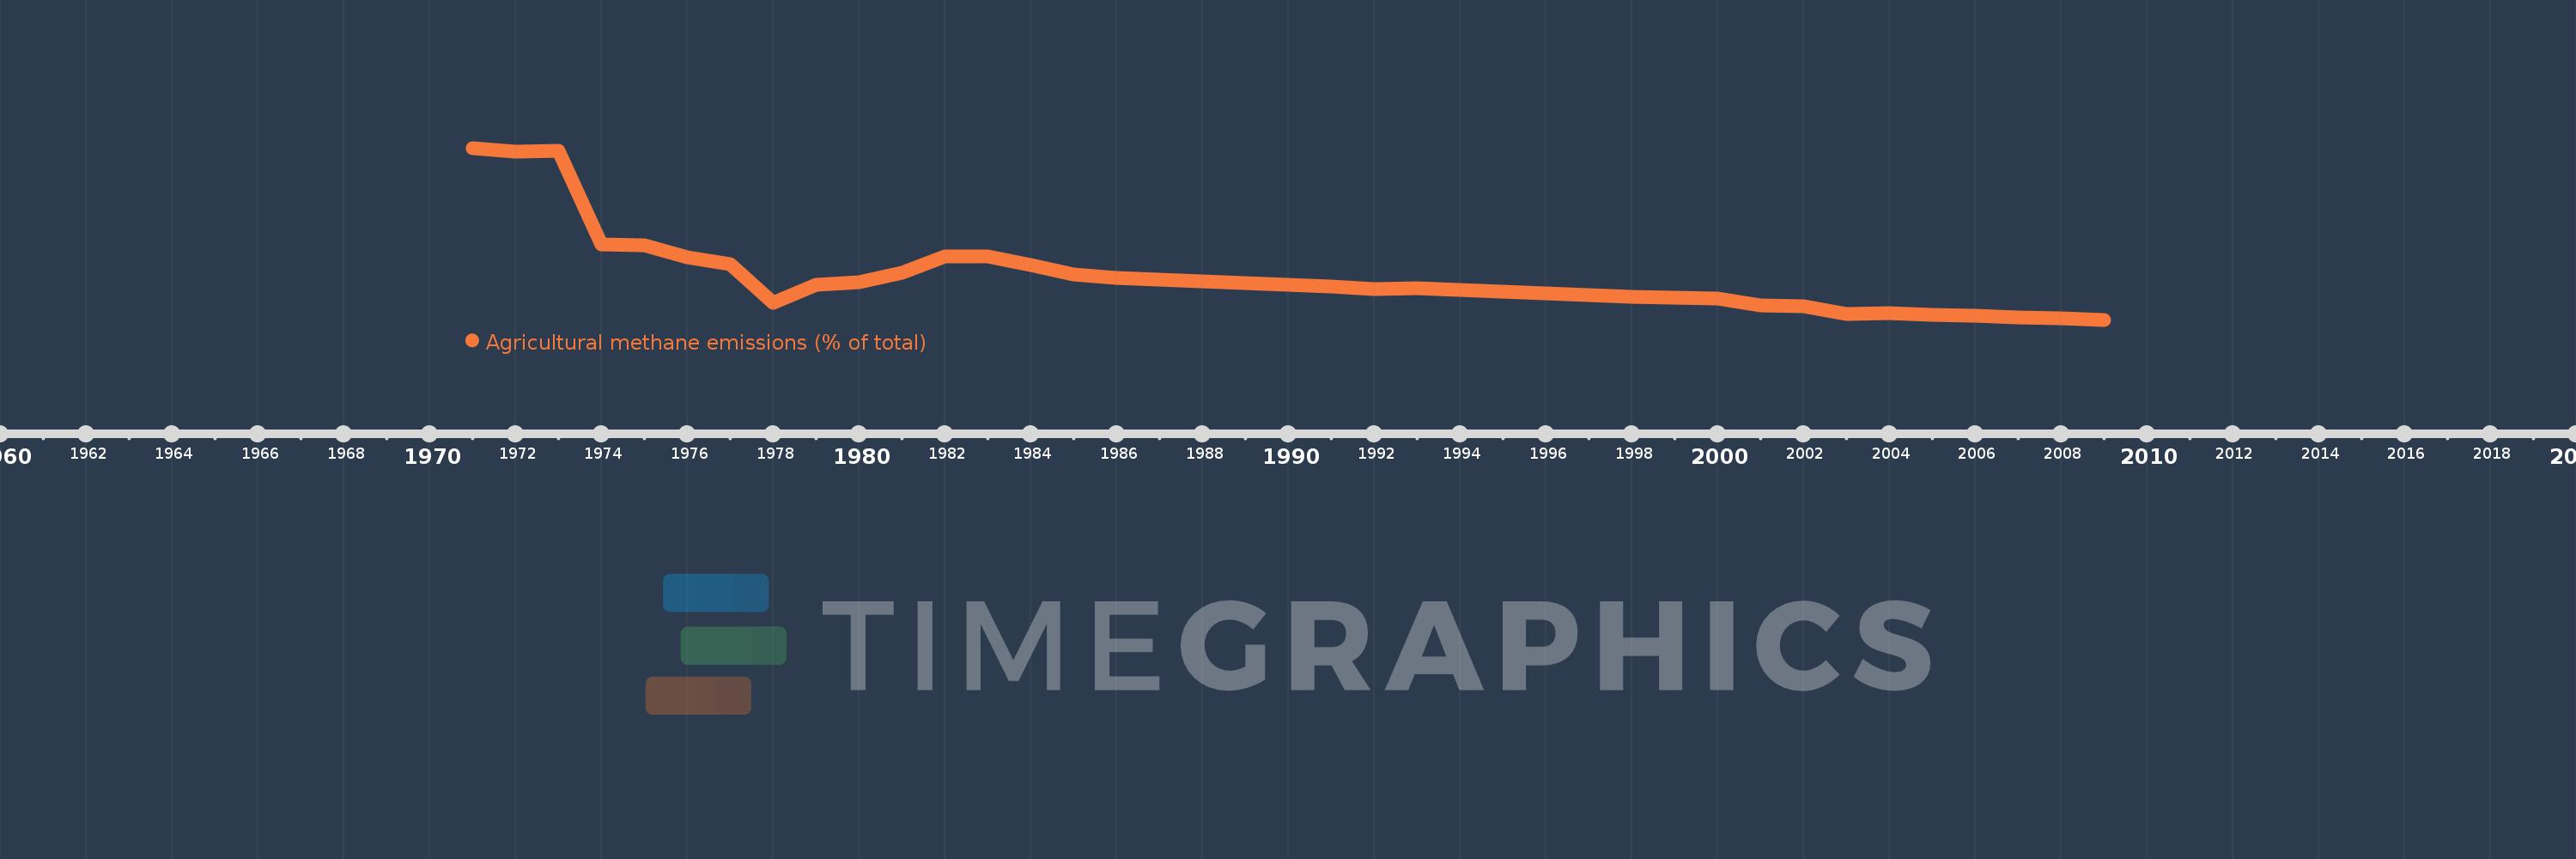
Agricultural methane emissions (% of total)
2009,2008,2007,2006,2005,2004,2003,2002,2001,2000,1999,1998,1997,1996,1995,1994,1993,1992,1991,1990,1989,1988,1987,1986,1985,1984,1983,1982,1981,1980,1979,1978,1977,1976,1975,1974,1973,1972,1971
This statistics in other country:
AfghanistanAlbaniaAlgeriaAmerican SamoaAngolaAntigua and BarbudaArab WorldArgentinaArmeniaArubaAustraliaAustriaAzerbaijanBahamas, TheBahrainBangladeshBarbadosBelarusBelgiumBelizeBeninBermudaBhutanBoliviaBosnia and HerzegovinaBotswanaBrazilBritish Virgin IslandsBrunei DarussalamBulgariaBurkina FasoBurundiCabo VerdeCambodiaCameroonCanadaCaribbean small statesCayman IslandsCentral African RepublicCentral Europe and the BalticsChadChileChinaColombiaComorosCongo, Dem. Rep.Congo, Rep.Costa RicaCote d'IvoireCroatiaCubaCyprusCzech RepublicDenmarkDjiboutiDominicaDominican RepublicEarly-demographic dividendEast Asia & PacificEast Asia & Pacific (excluding high income)East Asia & Pacific (IDA & IBRD countries)EcuadorEgypt, Arab Rep.El SalvadorEquatorial GuineaEritreaEstoniaEthiopiaEuro areaEurope & Central AsiaEurope & Central Asia (excluding high income)Europe & Central Asia (IDA & IBRD countries)European UnionFaroe IslandsFijiFinlandFragile and conflict affected situationsFranceFrench PolynesiaGabonGambia, TheGeorgiaGermanyGhanaGibraltarGreeceGreenlandGrenadaGuamGuatemalaGuineaGuinea-BissauGuyanaHaitiHeavily indebted poor countries (HIPC)High incomeHondurasHong Kong SAR, ChinaHungaryIBRD onlyIcelandIDA & IBRD totalIDA blendIDA onlyIDA totalIndiaIndonesiaIran, Islamic Rep.IraqIrelandIsraelItalyJamaicaJapanJordanKazakhstanKenyaKiribatiKorea, Dem. People’s Rep.Korea, Rep.KuwaitKyrgyz RepublicLao PDRLate-demographic dividendLatin America & Caribbean Latin America & Caribbean (excluding high income)Latin America & the Caribbean (IDA & IBRD countries)LatviaLeast developed countries: UN classificationLebanonLesothoLiberiaLibyaLithuaniaLow & middle incomeLow incomeLower middle incomeLuxembourgMacao SAR, ChinaMacedonia, FYRMadagascarMalawiMalaysiaMaldivesMaliMaltaMarshall IslandsMauritaniaMauritiusMexicoMicronesia, Fed. Sts.Middle East & North AfricaMiddle East & North Africa (excluding high income)Middle East & North Africa (IDA & IBRD countries)Middle incomeMoldovaMongoliaMoroccoMozambiqueMyanmarNamibiaNauruNepalNetherlandsNew CaledoniaNew ZealandNicaraguaNigerNigeriaNorth AmericaNorthern Mariana IslandsNorwayOECD membersOmanOther small statesPacific island small statesPakistanPalauPanamaPapua New GuineaParaguayPeruPhilippinesPolandPortugalPost-demographic dividendPre-demographic dividendPuerto RicoQatarRomaniaRussian FederationRwandaSamoaSao Tome and PrincipeSaudi ArabiaSenegalSerbiaSeychellesSierra LeoneSingaporeSlovak RepublicSloveniaSmall statesSolomon IslandsSomaliaSouth AfricaSouth AsiaSouth Asia (IDA & IBRD)SpainSri LankaSt. Kitts and NevisSt. LuciaSt. Vincent and the GrenadinesSub-Saharan Africa Sub-Saharan Africa (excluding high income)Sub-Saharan Africa (IDA & IBRD countries)SudanSurinameSwazilandSwedenSwitzerlandSyrian Arab RepublicTajikistanTanzaniaThailandTimor-LesteTogoTongaTrinidad and TobagoTunisiaTurkeyTurkmenistanTurks and Caicos IslandsTuvaluUgandaUkraineUnited Arab EmiratesUnited KingdomUnited StatesUpper middle incomeUruguayUzbekistanVanuatuVenezuela, RBVietnamVirgin Islands (U.S.)WorldYemen, Rep.ZambiaZimbabwe Timeline:
This timeline shows a graph from 1971 to 2009 of Greenland. No data until 1970. Number of actual observations by date: 39.
Source name:
World Development Indicators
Source organization:
World Bank staff estimates from original source: European Commission, Joint Research Centre (JRC)/Netherlands Environmental Assessment Agency (PBL). Emission Database for Global Atmospheric Research (EDGAR): http://edgar.jrc.ec.europa.eu/.
Categories, topics:
Agriculture & Rural Development, Environment
Last updated:
apr 23, 2017
Indicators value changes by year
Minimum:
11.798
jan 1, 2009
Maximum:
30.978
jan 1, 1971
At the date of observation
Value
Absolute change
Change from previous value
jan 1, 1971
30.978
+30.978
0.0%
jan 1, 1972
30.571
-0.408
-1.32%
jan 1, 1973
30.659
+0.089
0.29%
jan 1, 1974
20.246
-10.414
-33.97%
jan 1, 1975
20.142
-0.103
-0.51%
jan 1, 1976
18.767
-1.375
-6.83%
jan 1, 1977
18.048
-0.719
-3.83%
jan 1, 1978
13.692
-4.356
-24.13%
jan 1, 1979
15.724
+2.032
14.84%
jan 1, 1980
16.004
+0.28
1.78%
jan 1, 1981
17.071
+1.067
6.67%
jan 1, 1982
18.858
+1.787
10.47%
jan 1, 1983
18.866
+0.008
0.04%
jan 1, 1984
17.918
-0.948
-5.03%
jan 1, 1985
16.81
-1.108
-6.18%
jan 1, 1986
16.478
-0.332
-1.98%
jan 1, 1987
16.236
-0.242
-1.47%
jan 1, 1988
16.128
-0.108
-0.66%
jan 1, 1989
15.868
-0.26
-1.61%
jan 1, 1990
15.728
-0.14
-0.88%
jan 1, 1991
15.521
-0.207
-1.32%
jan 1, 1992
15.259
-0.262
-1.69%
jan 1, 1993
15.314
+0.055
0.36%
jan 1, 1994
15.092
-0.222
-1.45%
jan 1, 1995
14.893
-0.199
-1.32%
jan 1, 1996
14.713
-0.179
-1.2%
jan 1, 1997
14.551
-0.163
-1.1%
jan 1, 1998
14.403
-0.148
-1.02%
jan 1, 1999
14.275
-0.128
-0.89%
jan 1, 2000
14.16
-0.115
-0.81%
jan 1, 2001
13.393
-0.766
-5.41%
jan 1, 2002
13.262
-0.132
-0.98%
jan 1, 2003
12.423
-0.839
-6.33%
jan 1, 2004
12.535
+0.112
0.9%
jan 1, 2005
12.306
-0.229
-1.83%
jan 1, 2006
12.226
-0.08
-0.65%
jan 1, 2007
12.063
-0.163
-1.34%
jan 1, 2008
11.938
-0.124
-1.03%
jan 1, 2009
11.798
-0.141
-1.18%
Ranking of countries by current statistics by years


Comments: