29
/
en
AIzaSyAYiBZKx7MnpbEhh9jyipgxe19OcubqV5w
April 1, 2024
257028
Switzerland
CHE
true
2
1
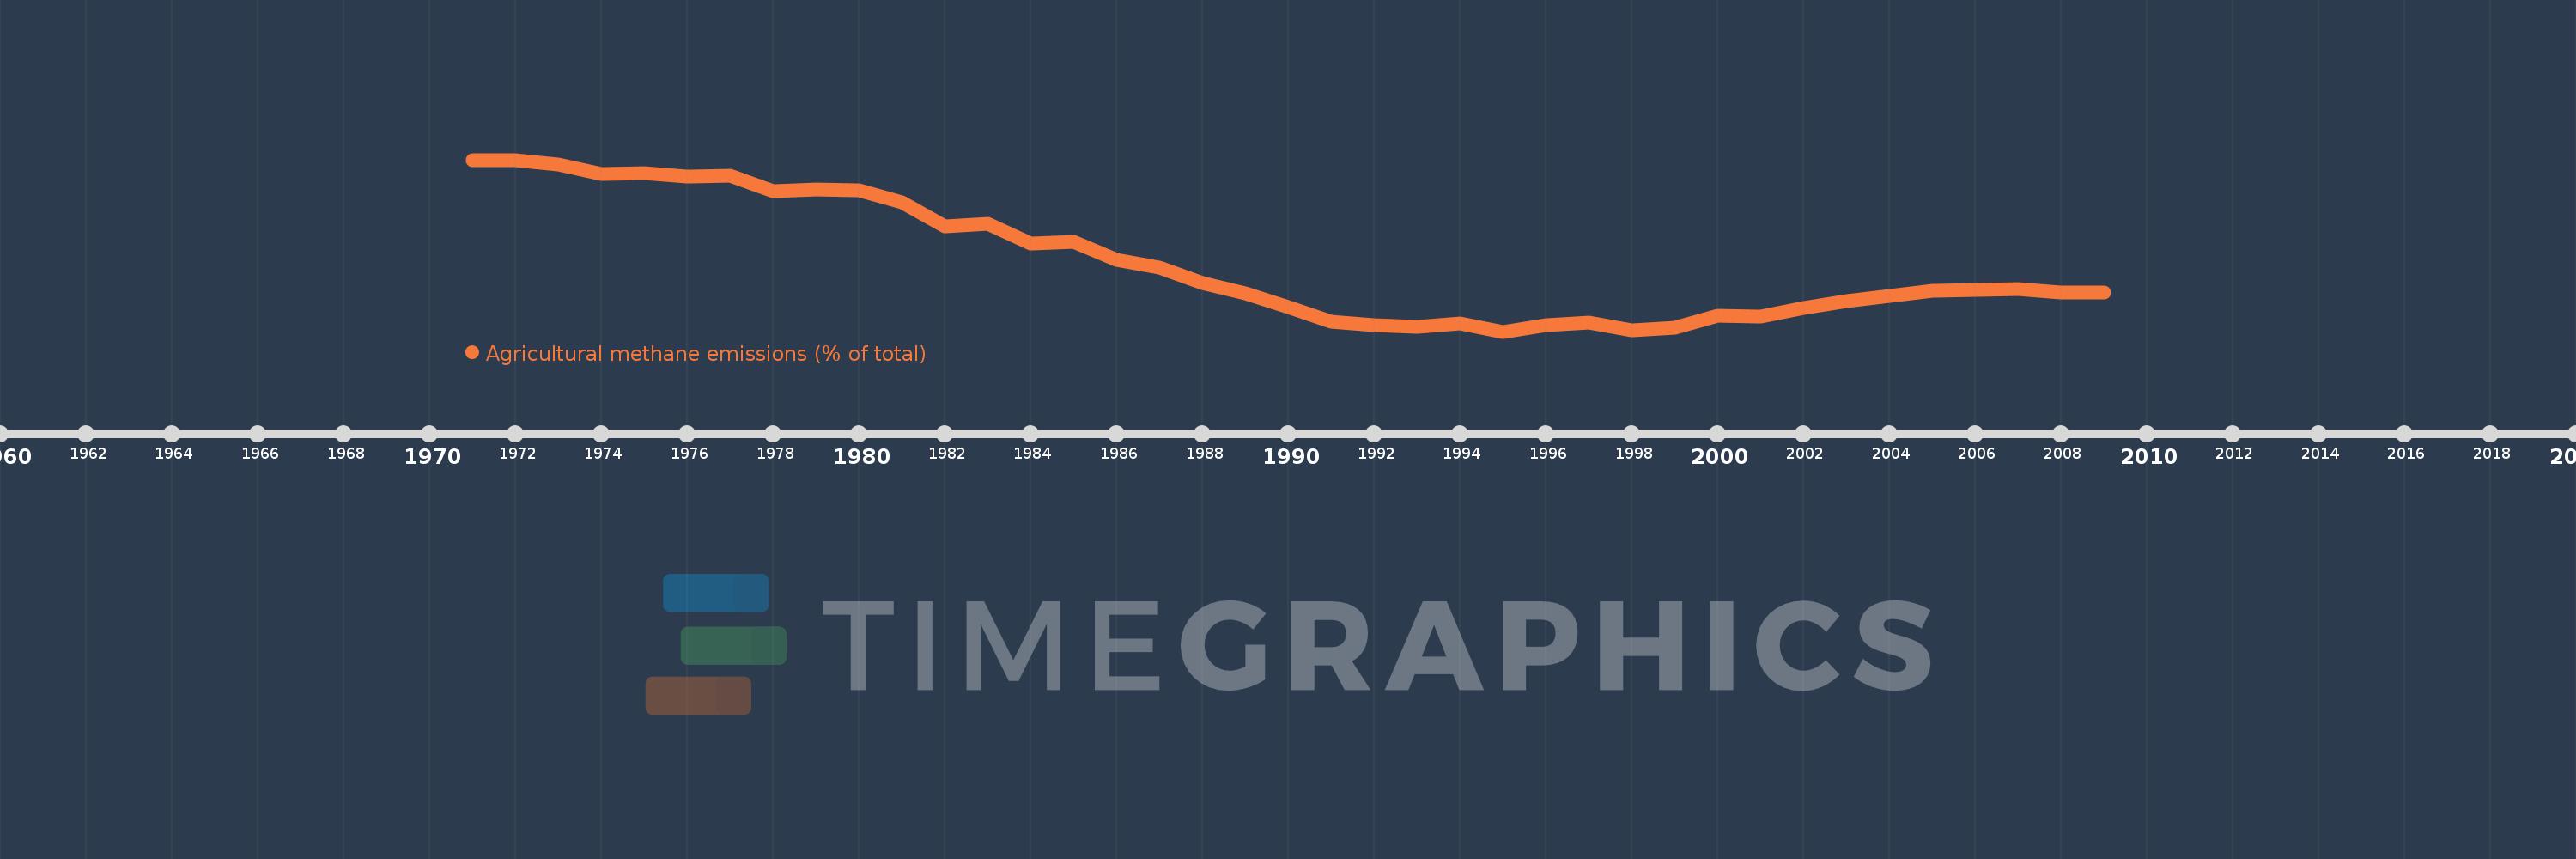
Agricultural methane emissions (% of total)
2009,2008,2007,2006,2005,2004,2003,2002,2001,2000,1999,1998,1997,1996,1995,1994,1993,1992,1991,1990,1989,1988,1987,1986,1985,1984,1983,1982,1981,1980,1979,1978,1977,1976,1975,1974,1973,1972,1971
This statistics in other country:
AfghanistanAlbaniaAlgeriaAmerican SamoaAngolaAntigua and BarbudaArab WorldArgentinaArmeniaArubaAustraliaAustriaAzerbaijanBahamas, TheBahrainBangladeshBarbadosBelarusBelgiumBelizeBeninBermudaBhutanBoliviaBosnia and HerzegovinaBotswanaBrazilBritish Virgin IslandsBrunei DarussalamBulgariaBurkina FasoBurundiCabo VerdeCambodiaCameroonCanadaCaribbean small statesCayman IslandsCentral African RepublicCentral Europe and the BalticsChadChileChinaColombiaComorosCongo, Dem. Rep.Congo, Rep.Costa RicaCote d'IvoireCroatiaCubaCyprusCzech RepublicDenmarkDjiboutiDominicaDominican RepublicEarly-demographic dividendEast Asia & PacificEast Asia & Pacific (excluding high income)East Asia & Pacific (IDA & IBRD countries)EcuadorEgypt, Arab Rep.El SalvadorEquatorial GuineaEritreaEstoniaEthiopiaEuro areaEurope & Central AsiaEurope & Central Asia (excluding high income)Europe & Central Asia (IDA & IBRD countries)European UnionFaroe IslandsFijiFinlandFragile and conflict affected situationsFranceFrench PolynesiaGabonGambia, TheGeorgiaGermanyGhanaGibraltarGreeceGreenlandGrenadaGuamGuatemalaGuineaGuinea-BissauGuyanaHaitiHeavily indebted poor countries (HIPC)High incomeHondurasHong Kong SAR, ChinaHungaryIBRD onlyIcelandIDA & IBRD totalIDA blendIDA onlyIDA totalIndiaIndonesiaIran, Islamic Rep.IraqIrelandIsraelItalyJamaicaJapanJordanKazakhstanKenyaKiribatiKorea, Dem. People’s Rep.Korea, Rep.KuwaitKyrgyz RepublicLao PDRLate-demographic dividendLatin America & Caribbean Latin America & Caribbean (excluding high income)Latin America & the Caribbean (IDA & IBRD countries)LatviaLeast developed countries: UN classificationLebanonLesothoLiberiaLibyaLithuaniaLow & middle incomeLow incomeLower middle incomeLuxembourgMacao SAR, ChinaMacedonia, FYRMadagascarMalawiMalaysiaMaldivesMaliMaltaMarshall IslandsMauritaniaMauritiusMexicoMicronesia, Fed. Sts.Middle East & North AfricaMiddle East & North Africa (excluding high income)Middle East & North Africa (IDA & IBRD countries)Middle incomeMoldovaMongoliaMoroccoMozambiqueMyanmarNamibiaNauruNepalNetherlandsNew CaledoniaNew ZealandNicaraguaNigerNigeriaNorth AmericaNorthern Mariana IslandsNorwayOECD membersOmanOther small statesPacific island small statesPakistanPalauPanamaPapua New GuineaParaguayPeruPhilippinesPolandPortugalPost-demographic dividendPre-demographic dividendPuerto RicoQatarRomaniaRussian FederationRwandaSamoaSao Tome and PrincipeSaudi ArabiaSenegalSerbiaSeychellesSierra LeoneSingaporeSlovak RepublicSloveniaSmall statesSolomon IslandsSomaliaSouth AfricaSouth AsiaSouth Asia (IDA & IBRD)SpainSri LankaSt. Kitts and NevisSt. LuciaSt. Vincent and the GrenadinesSub-Saharan Africa Sub-Saharan Africa (excluding high income)Sub-Saharan Africa (IDA & IBRD countries)SudanSurinameSwazilandSwedenSwitzerlandSyrian Arab RepublicTajikistanTanzaniaThailandTimor-LesteTogoTongaTrinidad and TobagoTunisiaTurkeyTurkmenistanTurks and Caicos IslandsTuvaluUgandaUkraineUnited Arab EmiratesUnited KingdomUnited StatesUpper middle incomeUruguayUzbekistanVanuatuVenezuela, RBVietnamVirgin Islands (U.S.)WorldYemen, Rep.ZambiaZimbabwe Timeline:
This timeline shows a graph from 1971 to 2009 of Switzerland. No data until 1970. Number of actual observations by date: 39.
Source name:
World Development Indicators
Source organization:
World Bank staff estimates from original source: European Commission, Joint Research Centre (JRC)/Netherlands Environmental Assessment Agency (PBL). Emission Database for Global Atmospheric Research (EDGAR): http://edgar.jrc.ec.europa.eu/.
Categories, topics:
Agriculture & Rural Development, Environment
Last updated:
apr 23, 2017
Indicators value changes by year
Minimum:
61.397
jan 1, 1995
Maximum:
75.306
jan 1, 1971
At the date of observation
Value
Absolute change
Change from previous value
jan 1, 1971
75.306
+75.306
0.0%
jan 1, 1972
75.24
-0.066
-0.09%
jan 1, 1973
74.938
-0.302
-0.4%
jan 1, 1974
74.131
-0.807
-1.08%
jan 1, 1975
74.25
+0.119
0.16%
jan 1, 1976
73.919
-0.33
-0.45%
jan 1, 1977
74.023
+0.104
0.14%
jan 1, 1978
72.761
-1.263
-1.71%
jan 1, 1979
72.889
+0.129
0.18%
jan 1, 1980
72.848
-0.042
-0.06%
jan 1, 1981
71.854
-0.994
-1.36%
jan 1, 1982
69.912
-1.942
-2.7%
jan 1, 1983
70.13
+0.218
0.31%
jan 1, 1984
68.56
-1.57
-2.24%
jan 1, 1985
68.675
+0.115
0.17%
jan 1, 1986
67.228
-1.447
-2.11%
jan 1, 1987
66.605
-0.622
-0.93%
jan 1, 1988
65.349
-1.257
-1.89%
jan 1, 1989
64.476
-0.873
-1.34%
jan 1, 1990
63.373
-1.103
-1.71%
jan 1, 1991
62.188
-1.185
-1.87%
jan 1, 1992
61.928
-0.259
-0.42%
jan 1, 1993
61.762
-0.167
-0.27%
jan 1, 1994
62.044
+0.283
0.46%
jan 1, 1995
61.397
-0.647
-1.04%
jan 1, 1996
61.918
+0.521
0.85%
jan 1, 1997
62.126
+0.208
0.34%
jan 1, 1998
61.467
-0.659
-1.06%
jan 1, 1999
61.69
+0.224
0.36%
jan 1, 2000
62.708
+1.018
1.65%
jan 1, 2001
62.638
-0.071
-0.11%
jan 1, 2002
63.28
+0.642
1.02%
jan 1, 2003
63.885
+0.605
0.96%
jan 1, 2004
64.284
+0.4
0.63%
jan 1, 2005
64.714
+0.43
0.67%
jan 1, 2006
64.787
+0.072
0.11%
jan 1, 2007
64.819
+0.032
0.05%
jan 1, 2008
64.586
-0.233
-0.36%
jan 1, 2009
64.56
-0.026
-0.04%
Ranking of countries by current statistics by years


Comments: