29
/
en
AIzaSyAYiBZKx7MnpbEhh9jyipgxe19OcubqV5w
April 1, 2024
139972
Ghana
GHA
true
2
1
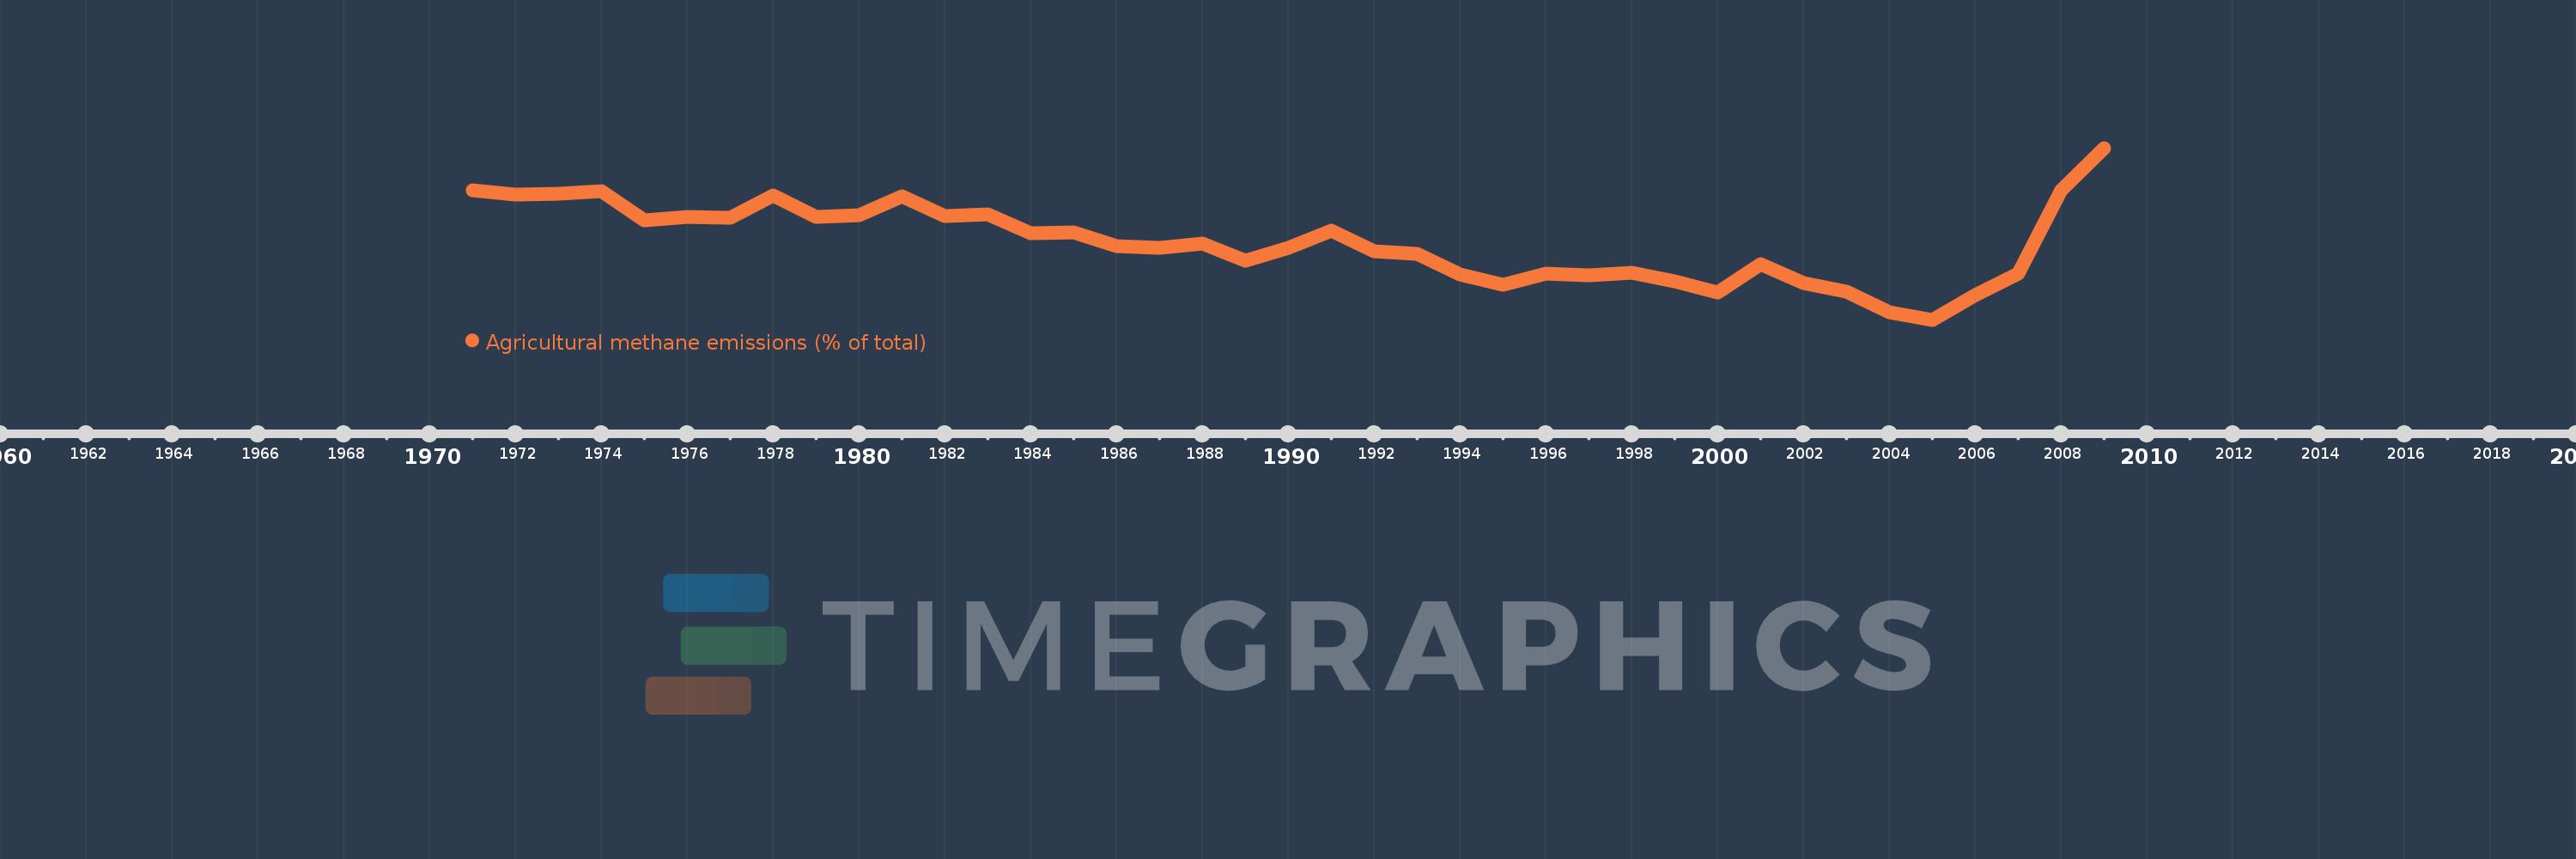
Agricultural methane emissions (% of total)
2009,2008,2007,2006,2005,2004,2003,2002,2001,2000,1999,1998,1997,1996,1995,1994,1993,1992,1991,1990,1989,1988,1987,1986,1985,1984,1983,1982,1981,1980,1979,1978,1977,1976,1975,1974,1973,1972,1971
This statistics in other country:
AfghanistanAlbaniaAlgeriaAmerican SamoaAngolaAntigua and BarbudaArab WorldArgentinaArmeniaArubaAustraliaAustriaAzerbaijanBahamas, TheBahrainBangladeshBarbadosBelarusBelgiumBelizeBeninBermudaBhutanBoliviaBosnia and HerzegovinaBotswanaBrazilBritish Virgin IslandsBrunei DarussalamBulgariaBurkina FasoBurundiCabo VerdeCambodiaCameroonCanadaCaribbean small statesCayman IslandsCentral African RepublicCentral Europe and the BalticsChadChileChinaColombiaComorosCongo, Dem. Rep.Congo, Rep.Costa RicaCote d'IvoireCroatiaCubaCyprusCzech RepublicDenmarkDjiboutiDominicaDominican RepublicEarly-demographic dividendEast Asia & PacificEast Asia & Pacific (excluding high income)East Asia & Pacific (IDA & IBRD countries)EcuadorEgypt, Arab Rep.El SalvadorEquatorial GuineaEritreaEstoniaEthiopiaEuro areaEurope & Central AsiaEurope & Central Asia (excluding high income)Europe & Central Asia (IDA & IBRD countries)European UnionFaroe IslandsFijiFinlandFragile and conflict affected situationsFranceFrench PolynesiaGabonGambia, TheGeorgiaGermanyGhanaGibraltarGreeceGreenlandGrenadaGuamGuatemalaGuineaGuinea-BissauGuyanaHaitiHeavily indebted poor countries (HIPC)High incomeHondurasHong Kong SAR, ChinaHungaryIBRD onlyIcelandIDA & IBRD totalIDA blendIDA onlyIDA totalIndiaIndonesiaIran, Islamic Rep.IraqIrelandIsraelItalyJamaicaJapanJordanKazakhstanKenyaKiribatiKorea, Dem. People’s Rep.Korea, Rep.KuwaitKyrgyz RepublicLao PDRLate-demographic dividendLatin America & Caribbean Latin America & Caribbean (excluding high income)Latin America & the Caribbean (IDA & IBRD countries)LatviaLeast developed countries: UN classificationLebanonLesothoLiberiaLibyaLithuaniaLow & middle incomeLow incomeLower middle incomeLuxembourgMacao SAR, ChinaMacedonia, FYRMadagascarMalawiMalaysiaMaldivesMaliMaltaMarshall IslandsMauritaniaMauritiusMexicoMicronesia, Fed. Sts.Middle East & North AfricaMiddle East & North Africa (excluding high income)Middle East & North Africa (IDA & IBRD countries)Middle incomeMoldovaMongoliaMoroccoMozambiqueMyanmarNamibiaNauruNepalNetherlandsNew CaledoniaNew ZealandNicaraguaNigerNigeriaNorth AmericaNorthern Mariana IslandsNorwayOECD membersOmanOther small statesPacific island small statesPakistanPalauPanamaPapua New GuineaParaguayPeruPhilippinesPolandPortugalPost-demographic dividendPre-demographic dividendPuerto RicoQatarRomaniaRussian FederationRwandaSamoaSao Tome and PrincipeSaudi ArabiaSenegalSerbiaSeychellesSierra LeoneSingaporeSlovak RepublicSloveniaSmall statesSolomon IslandsSomaliaSouth AfricaSouth AsiaSouth Asia (IDA & IBRD)SpainSri LankaSt. Kitts and NevisSt. LuciaSt. Vincent and the GrenadinesSub-Saharan Africa Sub-Saharan Africa (excluding high income)Sub-Saharan Africa (IDA & IBRD countries)SudanSurinameSwazilandSwedenSwitzerlandSyrian Arab RepublicTajikistanTanzaniaThailandTimor-LesteTogoTongaTrinidad and TobagoTunisiaTurkeyTurkmenistanTurks and Caicos IslandsTuvaluUgandaUkraineUnited Arab EmiratesUnited KingdomUnited StatesUpper middle incomeUruguayUzbekistanVanuatuVenezuela, RBVietnamVirgin Islands (U.S.)WorldYemen, Rep.ZambiaZimbabwe Timeline:
This timeline shows a graph from 1971 to 2009 of Ghana. No data until 1970. Number of actual observations by date: 39.
Source name:
World Development Indicators
Source organization:
World Bank staff estimates from original source: European Commission, Joint Research Centre (JRC)/Netherlands Environmental Assessment Agency (PBL). Emission Database for Global Atmospheric Research (EDGAR): http://edgar.jrc.ec.europa.eu/.
Categories, topics:
Agriculture & Rural Development, Environment
Last updated:
apr 23, 2017
Indicators value changes by year
Minimum:
33.069
jan 1, 2005
Maximum:
60.247
jan 1, 2009
At the date of observation
Value
Absolute change
Change from previous value
jan 1, 1971
53.604
+53.604
0.0%
jan 1, 1972
52.855
-0.749
-1.4%
jan 1, 1973
53.018
+0.164
0.31%
jan 1, 1974
53.365
+0.347
0.65%
jan 1, 1975
48.799
-4.566
-8.56%
jan 1, 1976
49.353
+0.554
1.14%
jan 1, 1977
49.153
-0.2
-0.41%
jan 1, 1978
52.709
+3.556
7.23%
jan 1, 1979
49.358
-3.351
-6.36%
jan 1, 1980
49.629
+0.271
0.55%
jan 1, 1981
52.612
+2.982
6.01%
jan 1, 1982
49.527
-3.085
-5.86%
jan 1, 1983
49.73
+0.203
0.41%
jan 1, 1984
46.785
-2.945
-5.92%
jan 1, 1985
46.834
+0.048
0.1%
jan 1, 1986
44.696
-2.137
-4.56%
jan 1, 1987
44.51
-0.186
-0.42%
jan 1, 1988
45.109
+0.599
1.35%
jan 1, 1989
42.437
-2.673
-5.92%
jan 1, 1990
44.398
+1.961
4.62%
jan 1, 1991
47.113
+2.716
6.12%
jan 1, 1992
43.966
-3.147
-6.68%
jan 1, 1993
43.548
-0.418
-0.95%
jan 1, 1994
40.253
-3.295
-7.57%
jan 1, 1995
38.632
-1.621
-4.03%
jan 1, 1996
40.381
+1.749
4.53%
jan 1, 1997
40.131
-0.25
-0.62%
jan 1, 1998
40.464
+0.333
0.83%
jan 1, 1999
39.211
-1.252
-3.09%
jan 1, 2000
37.37
-1.841
-4.7%
jan 1, 2001
41.91
+4.539
12.15%
jan 1, 2002
38.816
-3.094
-7.38%
jan 1, 2003
37.535
-1.28
-3.3%
jan 1, 2004
34.283
-3.253
-8.67%
jan 1, 2005
33.069
-1.213
-3.54%
jan 1, 2006
36.94
+3.871
11.71%
jan 1, 2007
40.37
+3.43
9.28%
jan 1, 2008
53.55
+13.18
32.65%
jan 1, 2009
60.247
+6.698
12.51%
Ranking of countries by current statistics by years


Comments: