29
/
en
AIzaSyAYiBZKx7MnpbEhh9jyipgxe19OcubqV5w
April 1, 2024
228091
Romania
ROU
true
2
1
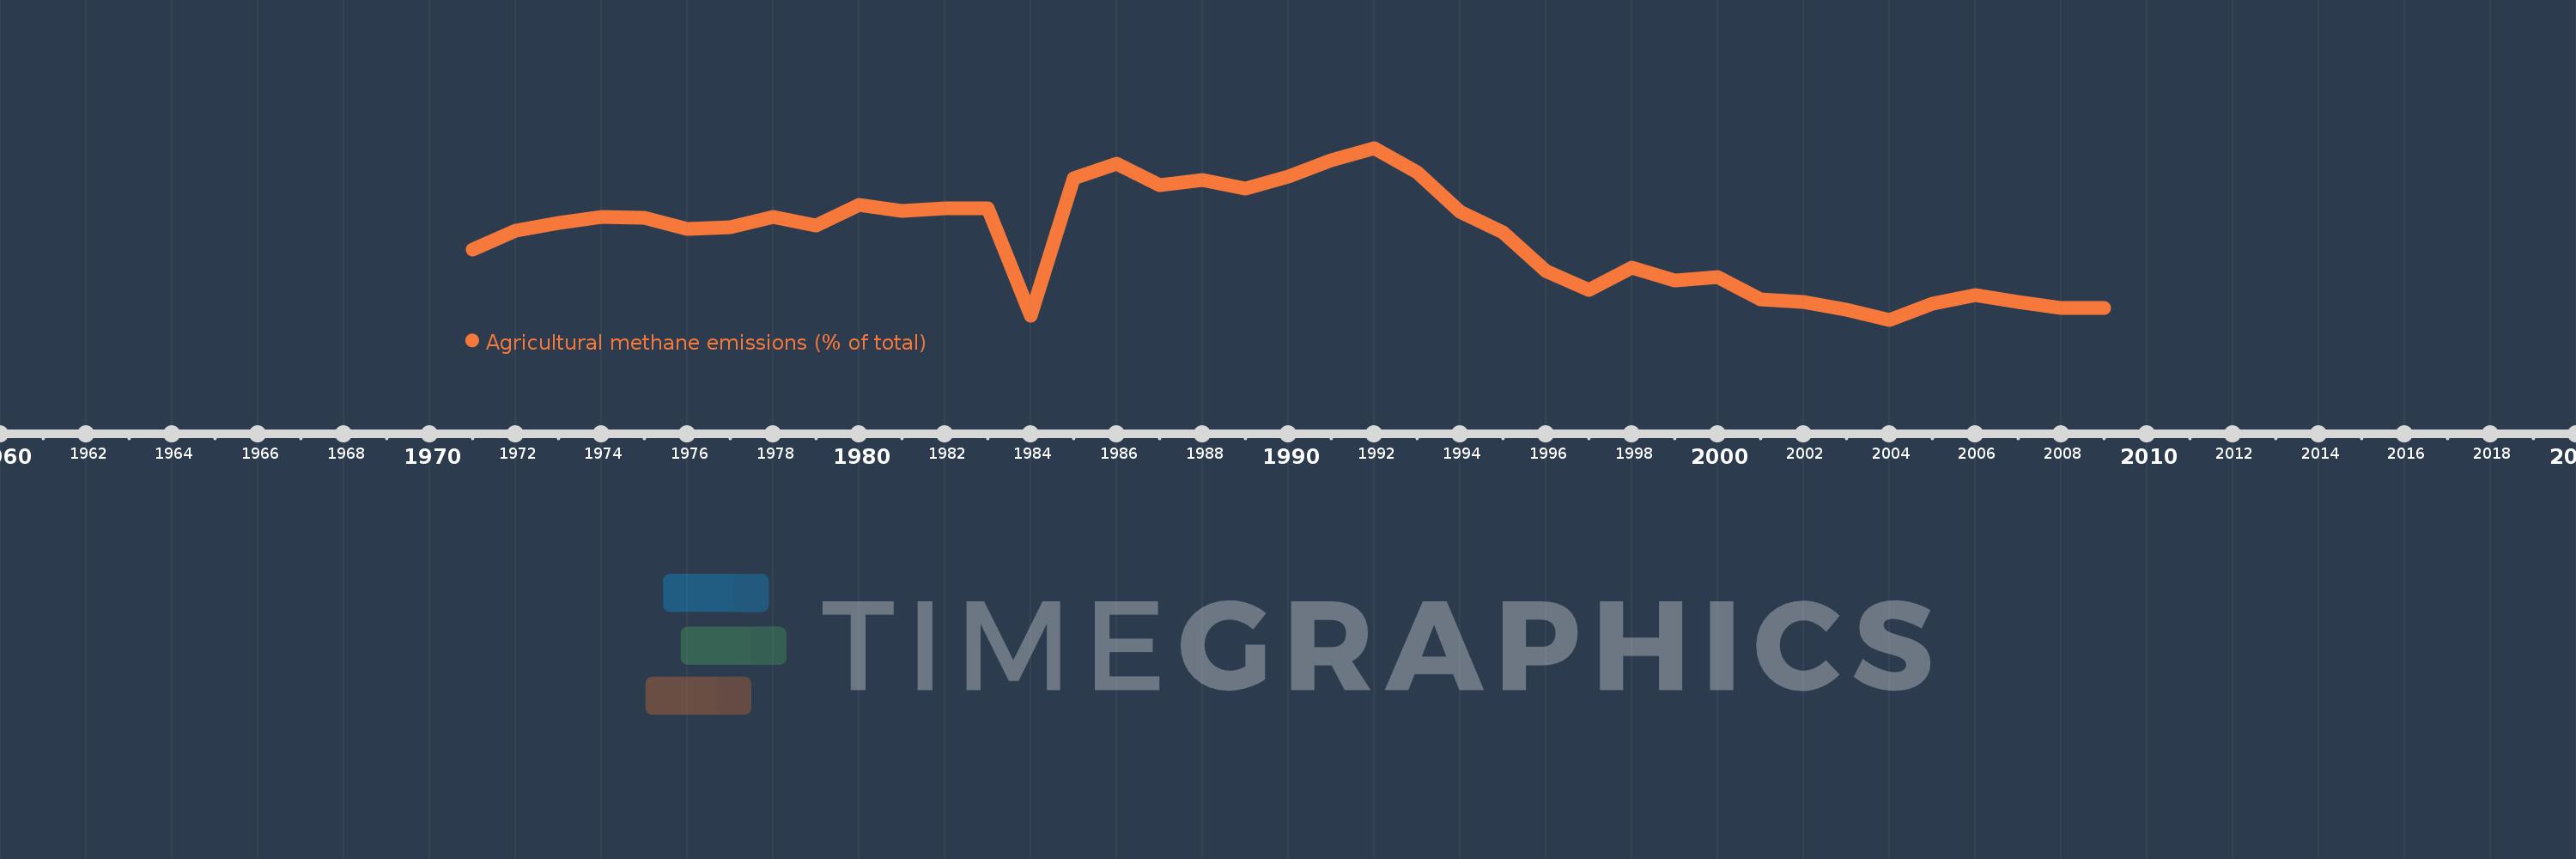
Agricultural methane emissions (% of total)
2009,2008,2007,2006,2005,2004,2003,2002,2001,2000,1999,1998,1997,1996,1995,1994,1993,1992,1991,1990,1989,1988,1987,1986,1985,1984,1983,1982,1981,1980,1979,1978,1977,1976,1975,1974,1973,1972,1971
This statistics in other country:
AfghanistanAlbaniaAlgeriaAmerican SamoaAngolaAntigua and BarbudaArab WorldArgentinaArmeniaArubaAustraliaAustriaAzerbaijanBahamas, TheBahrainBangladeshBarbadosBelarusBelgiumBelizeBeninBermudaBhutanBoliviaBosnia and HerzegovinaBotswanaBrazilBritish Virgin IslandsBrunei DarussalamBulgariaBurkina FasoBurundiCabo VerdeCambodiaCameroonCanadaCaribbean small statesCayman IslandsCentral African RepublicCentral Europe and the BalticsChadChileChinaColombiaComorosCongo, Dem. Rep.Congo, Rep.Costa RicaCote d'IvoireCroatiaCubaCyprusCzech RepublicDenmarkDjiboutiDominicaDominican RepublicEarly-demographic dividendEast Asia & PacificEast Asia & Pacific (excluding high income)East Asia & Pacific (IDA & IBRD countries)EcuadorEgypt, Arab Rep.El SalvadorEquatorial GuineaEritreaEstoniaEthiopiaEuro areaEurope & Central AsiaEurope & Central Asia (excluding high income)Europe & Central Asia (IDA & IBRD countries)European UnionFaroe IslandsFijiFinlandFragile and conflict affected situationsFranceFrench PolynesiaGabonGambia, TheGeorgiaGermanyGhanaGibraltarGreeceGreenlandGrenadaGuamGuatemalaGuineaGuinea-BissauGuyanaHaitiHeavily indebted poor countries (HIPC)High incomeHondurasHong Kong SAR, ChinaHungaryIBRD onlyIcelandIDA & IBRD totalIDA blendIDA onlyIDA totalIndiaIndonesiaIran, Islamic Rep.IraqIrelandIsraelItalyJamaicaJapanJordanKazakhstanKenyaKiribatiKorea, Dem. People’s Rep.Korea, Rep.KuwaitKyrgyz RepublicLao PDRLate-demographic dividendLatin America & Caribbean Latin America & Caribbean (excluding high income)Latin America & the Caribbean (IDA & IBRD countries)LatviaLeast developed countries: UN classificationLebanonLesothoLiberiaLibyaLithuaniaLow & middle incomeLow incomeLower middle incomeLuxembourgMacao SAR, ChinaMacedonia, FYRMadagascarMalawiMalaysiaMaldivesMaliMaltaMarshall IslandsMauritaniaMauritiusMexicoMicronesia, Fed. Sts.Middle East & North AfricaMiddle East & North Africa (excluding high income)Middle East & North Africa (IDA & IBRD countries)Middle incomeMoldovaMongoliaMoroccoMozambiqueMyanmarNamibiaNauruNepalNetherlandsNew CaledoniaNew ZealandNicaraguaNigerNigeriaNorth AmericaNorthern Mariana IslandsNorwayOECD membersOmanOther small statesPacific island small statesPakistanPalauPanamaPapua New GuineaParaguayPeruPhilippinesPolandPortugalPost-demographic dividendPre-demographic dividendPuerto RicoQatarRomaniaRussian FederationRwandaSamoaSao Tome and PrincipeSaudi ArabiaSenegalSerbiaSeychellesSierra LeoneSingaporeSlovak RepublicSloveniaSmall statesSolomon IslandsSomaliaSouth AfricaSouth AsiaSouth Asia (IDA & IBRD)SpainSri LankaSt. Kitts and NevisSt. LuciaSt. Vincent and the GrenadinesSub-Saharan Africa Sub-Saharan Africa (excluding high income)Sub-Saharan Africa (IDA & IBRD countries)SudanSurinameSwazilandSwedenSwitzerlandSyrian Arab RepublicTajikistanTanzaniaThailandTimor-LesteTogoTongaTrinidad and TobagoTunisiaTurkeyTurkmenistanTurks and Caicos IslandsTuvaluUgandaUkraineUnited Arab EmiratesUnited KingdomUnited StatesUpper middle incomeUruguayUzbekistanVanuatuVenezuela, RBVietnamVirgin Islands (U.S.)WorldYemen, Rep.ZambiaZimbabwe Timeline:
This timeline shows a graph from 1971 to 2009 of Romania. No data until 1970. Number of actual observations by date: 39.
Source name:
World Development Indicators
Source organization:
World Bank staff estimates from original source: European Commission, Joint Research Centre (JRC)/Netherlands Environmental Assessment Agency (PBL). Emission Database for Global Atmospheric Research (EDGAR): http://edgar.jrc.ec.europa.eu/.
Categories, topics:
Agriculture & Rural Development, Environment
Last updated:
apr 23, 2017
Indicators value changes by year
Minimum:
32.217
jan 1, 2004
Maximum:
42.651
jan 1, 1992
At the date of observation
Value
Absolute change
Change from previous value
jan 1, 1971
36.503
+36.503
0.0%
jan 1, 1972
37.615
+1.111
3.04%
jan 1, 1973
38.102
+0.487
1.29%
jan 1, 1974
38.455
+0.354
0.93%
jan 1, 1975
38.39
-0.065
-0.17%
jan 1, 1976
37.719
-0.671
-1.75%
jan 1, 1977
37.818
+0.099
0.26%
jan 1, 1978
38.473
+0.655
1.73%
jan 1, 1979
37.949
-0.524
-1.36%
jan 1, 1980
39.174
+1.225
3.23%
jan 1, 1981
38.81
-0.364
-0.93%
jan 1, 1982
38.997
+0.187
0.48%
jan 1, 1983
39.004
+0.008
0.02%
jan 1, 1984
32.468
-6.536
-16.76%
jan 1, 1985
40.797
+8.329
25.65%
jan 1, 1986
41.694
+0.897
2.2%
jan 1, 1987
40.414
-1.28
-3.07%
jan 1, 1988
40.703
+0.289
0.71%
jan 1, 1989
40.163
-0.539
-1.33%
jan 1, 1990
40.907
+0.744
1.85%
jan 1, 1991
41.883
+0.976
2.39%
jan 1, 1992
42.651
+0.768
1.83%
jan 1, 1993
41.156
-1.494
-3.5%
jan 1, 1994
38.751
-2.405
-5.84%
jan 1, 1995
37.535
-1.216
-3.14%
jan 1, 1996
35.194
-2.341
-6.24%
jan 1, 1997
34.038
-1.157
-3.29%
jan 1, 1998
35.358
+1.32
3.88%
jan 1, 1999
34.615
-0.743
-2.1%
jan 1, 2000
34.798
+0.183
0.53%
jan 1, 2001
33.455
-1.343
-3.86%
jan 1, 2002
33.281
-0.174
-0.52%
jan 1, 2003
32.83
-0.451
-1.36%
jan 1, 2004
32.217
-0.613
-1.87%
jan 1, 2005
33.214
+0.998
3.1%
jan 1, 2006
33.714
+0.5
1.51%
jan 1, 2007
33.271
-0.443
-1.31%
jan 1, 2008
32.949
-0.322
-0.97%
jan 1, 2009
32.93
-0.02
-0.06%
Ranking of countries by current statistics by years


Comments: