29
/
en
AIzaSyAYiBZKx7MnpbEhh9jyipgxe19OcubqV5w
April 1, 2024
203831
Myanmar
MMR
true
2
1
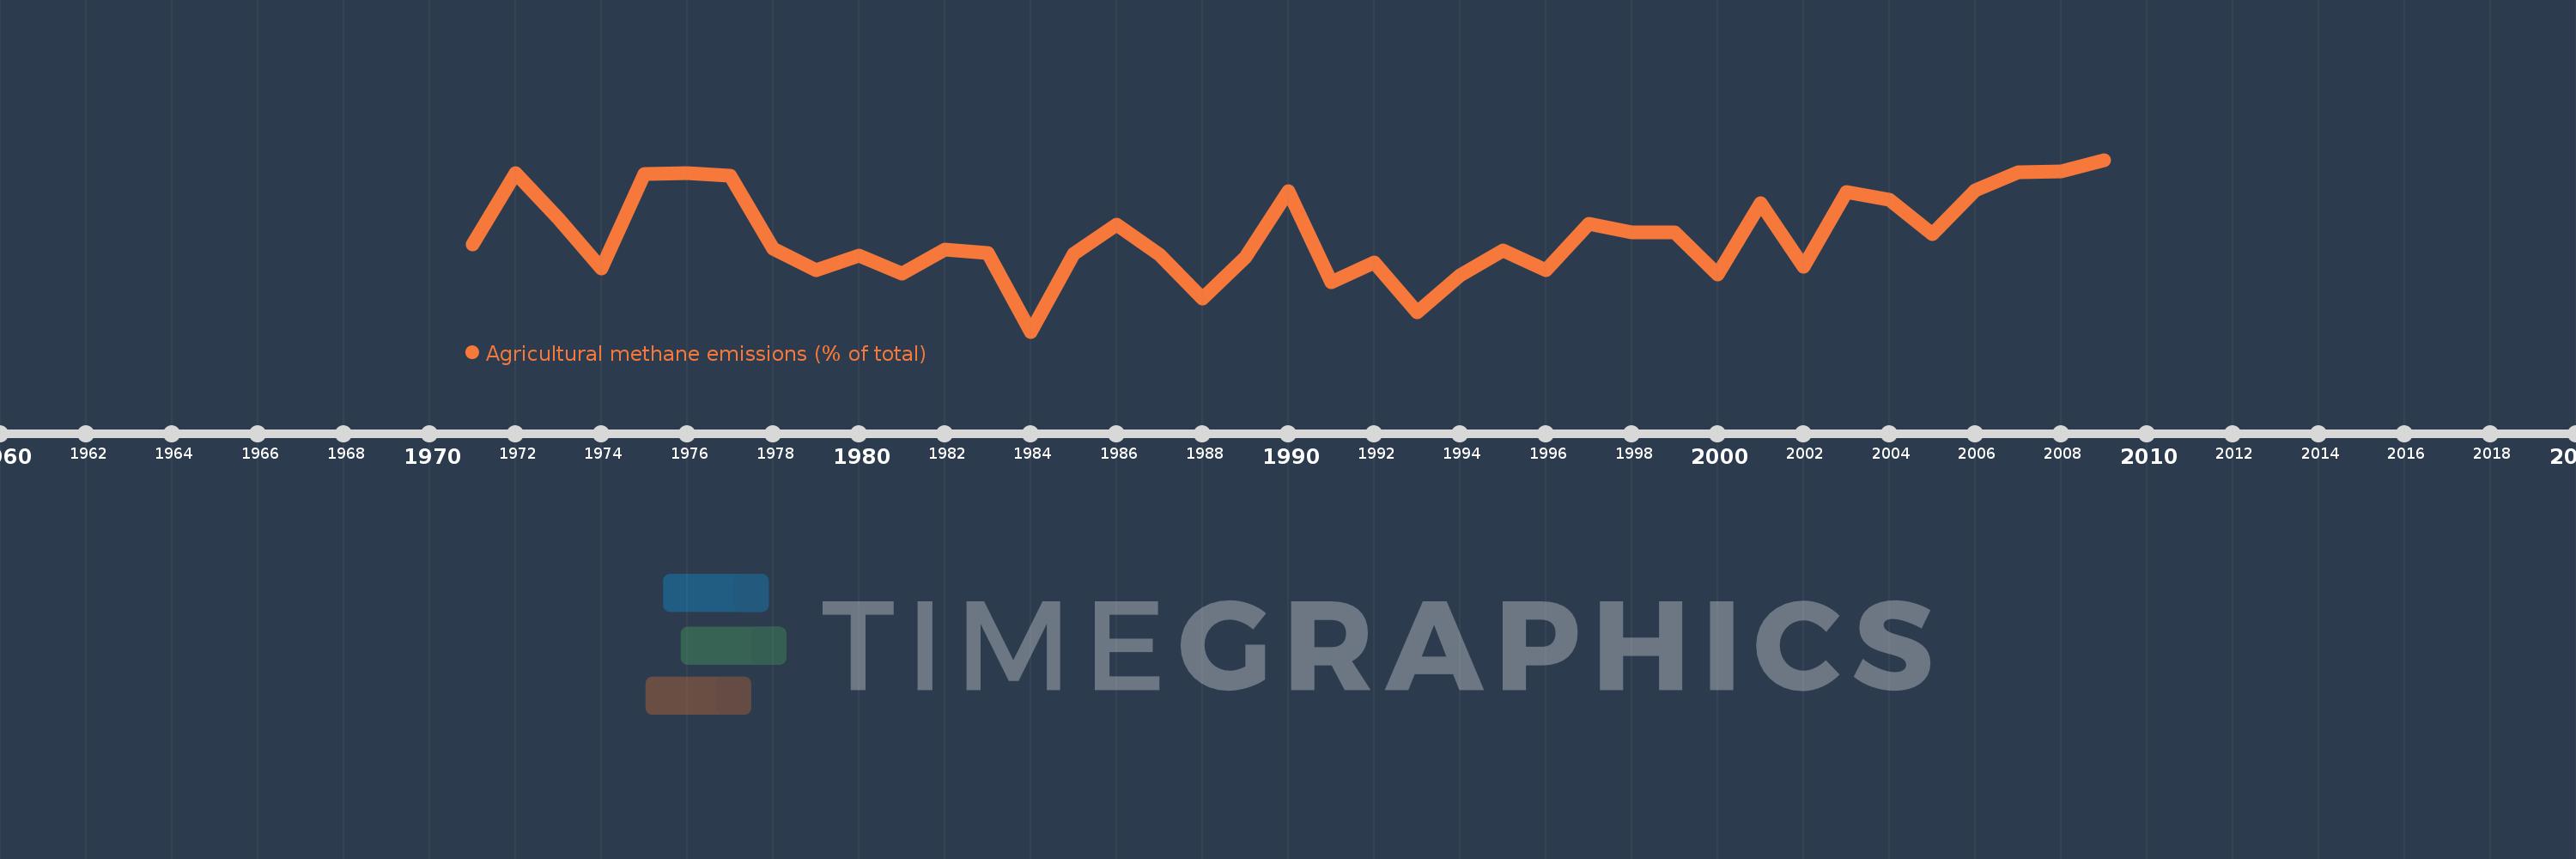
Agricultural methane emissions (% of total)
2009,2008,2007,2006,2005,2004,2003,2002,2001,2000,1999,1998,1997,1996,1995,1994,1993,1992,1991,1990,1989,1988,1987,1986,1985,1984,1983,1982,1981,1980,1979,1978,1977,1976,1975,1974,1973,1972,1971
This statistics in other country:
AfghanistanAlbaniaAlgeriaAmerican SamoaAngolaAntigua and BarbudaArab WorldArgentinaArmeniaArubaAustraliaAustriaAzerbaijanBahamas, TheBahrainBangladeshBarbadosBelarusBelgiumBelizeBeninBermudaBhutanBoliviaBosnia and HerzegovinaBotswanaBrazilBritish Virgin IslandsBrunei DarussalamBulgariaBurkina FasoBurundiCabo VerdeCambodiaCameroonCanadaCaribbean small statesCayman IslandsCentral African RepublicCentral Europe and the BalticsChadChileChinaColombiaComorosCongo, Dem. Rep.Congo, Rep.Costa RicaCote d'IvoireCroatiaCubaCyprusCzech RepublicDenmarkDjiboutiDominicaDominican RepublicEarly-demographic dividendEast Asia & PacificEast Asia & Pacific (excluding high income)East Asia & Pacific (IDA & IBRD countries)EcuadorEgypt, Arab Rep.El SalvadorEquatorial GuineaEritreaEstoniaEthiopiaEuro areaEurope & Central AsiaEurope & Central Asia (excluding high income)Europe & Central Asia (IDA & IBRD countries)European UnionFaroe IslandsFijiFinlandFragile and conflict affected situationsFranceFrench PolynesiaGabonGambia, TheGeorgiaGermanyGhanaGibraltarGreeceGreenlandGrenadaGuamGuatemalaGuineaGuinea-BissauGuyanaHaitiHeavily indebted poor countries (HIPC)High incomeHondurasHong Kong SAR, ChinaHungaryIBRD onlyIcelandIDA & IBRD totalIDA blendIDA onlyIDA totalIndiaIndonesiaIran, Islamic Rep.IraqIrelandIsraelItalyJamaicaJapanJordanKazakhstanKenyaKiribatiKorea, Dem. People’s Rep.Korea, Rep.KuwaitKyrgyz RepublicLao PDRLate-demographic dividendLatin America & Caribbean Latin America & Caribbean (excluding high income)Latin America & the Caribbean (IDA & IBRD countries)LatviaLeast developed countries: UN classificationLebanonLesothoLiberiaLibyaLithuaniaLow & middle incomeLow incomeLower middle incomeLuxembourgMacao SAR, ChinaMacedonia, FYRMadagascarMalawiMalaysiaMaldivesMaliMaltaMarshall IslandsMauritaniaMauritiusMexicoMicronesia, Fed. Sts.Middle East & North AfricaMiddle East & North Africa (excluding high income)Middle East & North Africa (IDA & IBRD countries)Middle incomeMoldovaMongoliaMoroccoMozambiqueMyanmarNamibiaNauruNepalNetherlandsNew CaledoniaNew ZealandNicaraguaNigerNigeriaNorth AmericaNorthern Mariana IslandsNorwayOECD membersOmanOther small statesPacific island small statesPakistanPalauPanamaPapua New GuineaParaguayPeruPhilippinesPolandPortugalPost-demographic dividendPre-demographic dividendPuerto RicoQatarRomaniaRussian FederationRwandaSamoaSao Tome and PrincipeSaudi ArabiaSenegalSerbiaSeychellesSierra LeoneSingaporeSlovak RepublicSloveniaSmall statesSolomon IslandsSomaliaSouth AfricaSouth AsiaSouth Asia (IDA & IBRD)SpainSri LankaSt. Kitts and NevisSt. LuciaSt. Vincent and the GrenadinesSub-Saharan Africa Sub-Saharan Africa (excluding high income)Sub-Saharan Africa (IDA & IBRD countries)SudanSurinameSwazilandSwedenSwitzerlandSyrian Arab RepublicTajikistanTanzaniaThailandTimor-LesteTogoTongaTrinidad and TobagoTunisiaTurkeyTurkmenistanTurks and Caicos IslandsTuvaluUgandaUkraineUnited Arab EmiratesUnited KingdomUnited StatesUpper middle incomeUruguayUzbekistanVanuatuVenezuela, RBVietnamVirgin Islands (U.S.)WorldYemen, Rep.ZambiaZimbabwe Timeline:
This timeline shows a graph from 1971 to 2009 of Myanmar. No data until 1970. Number of actual observations by date: 39.
Source name:
World Development Indicators
Source organization:
World Bank staff estimates from original source: European Commission, Joint Research Centre (JRC)/Netherlands Environmental Assessment Agency (PBL). Emission Database for Global Atmospheric Research (EDGAR): http://edgar.jrc.ec.europa.eu/.
Categories, topics:
Agriculture & Rural Development, Environment
Last updated:
apr 23, 2017
Indicators value changes by year
Minimum:
34.085
jan 1, 1984
Maximum:
77.011
jan 1, 2009
At the date of observation
Value
Absolute change
Change from previous value
jan 1, 1971
55.873
+55.873
0.0%
jan 1, 1972
73.766
+17.893
32.02%
jan 1, 1973
62.225
-11.541
-15.65%
jan 1, 1974
49.755
-12.469
-20.04%
jan 1, 1975
73.404
+23.649
47.53%
jan 1, 1976
73.655
+0.251
0.34%
jan 1, 1977
73.101
-0.554
-0.75%
jan 1, 1978
54.81
-18.29
-25.02%
jan 1, 1979
49.401
-5.41
-9.87%
jan 1, 1980
53.164
+3.763
7.62%
jan 1, 1981
48.612
-4.553
-8.56%
jan 1, 1982
54.641
+6.03
12.4%
jan 1, 1983
53.718
-0.923
-1.69%
jan 1, 1984
34.085
-19.633
-36.55%
jan 1, 1985
53.491
+19.406
56.93%
jan 1, 1986
60.804
+7.313
13.67%
jan 1, 1987
53.236
-7.568
-12.45%
jan 1, 1988
42.296
-10.94
-20.55%
jan 1, 1989
52.567
+10.272
24.29%
jan 1, 1990
69.086
+16.518
31.42%
jan 1, 1991
46.413
-22.672
-32.82%
jan 1, 1992
51.278
+4.865
10.48%
jan 1, 1993
38.865
-12.413
-24.21%
jan 1, 1994
48.244
+9.379
24.13%
jan 1, 1995
54.388
+6.143
12.73%
jan 1, 1996
49.328
-5.059
-9.3%
jan 1, 1997
61.095
+11.767
23.85%
jan 1, 1998
58.974
-2.121
-3.47%
jan 1, 1999
58.828
-0.146
-0.25%
jan 1, 2000
48.339
-10.489
-17.83%
jan 1, 2001
66.127
+17.788
36.8%
jan 1, 2002
50.222
-15.905
-24.05%
jan 1, 2003
69.005
+18.783
37.4%
jan 1, 2004
66.93
-2.074
-3.01%
jan 1, 2005
58.522
-8.408
-12.56%
jan 1, 2006
69.449
+10.927
18.67%
jan 1, 2007
73.93
+4.481
6.45%
jan 1, 2008
74.182
+0.251
0.34%
jan 1, 2009
77.011
+2.829
3.81%
Ranking of countries by current statistics by years


Comments: