29
/
en
AIzaSyAYiBZKx7MnpbEhh9jyipgxe19OcubqV5w
April 1, 2024
271324
Tuvalu
TUV
true
2
1
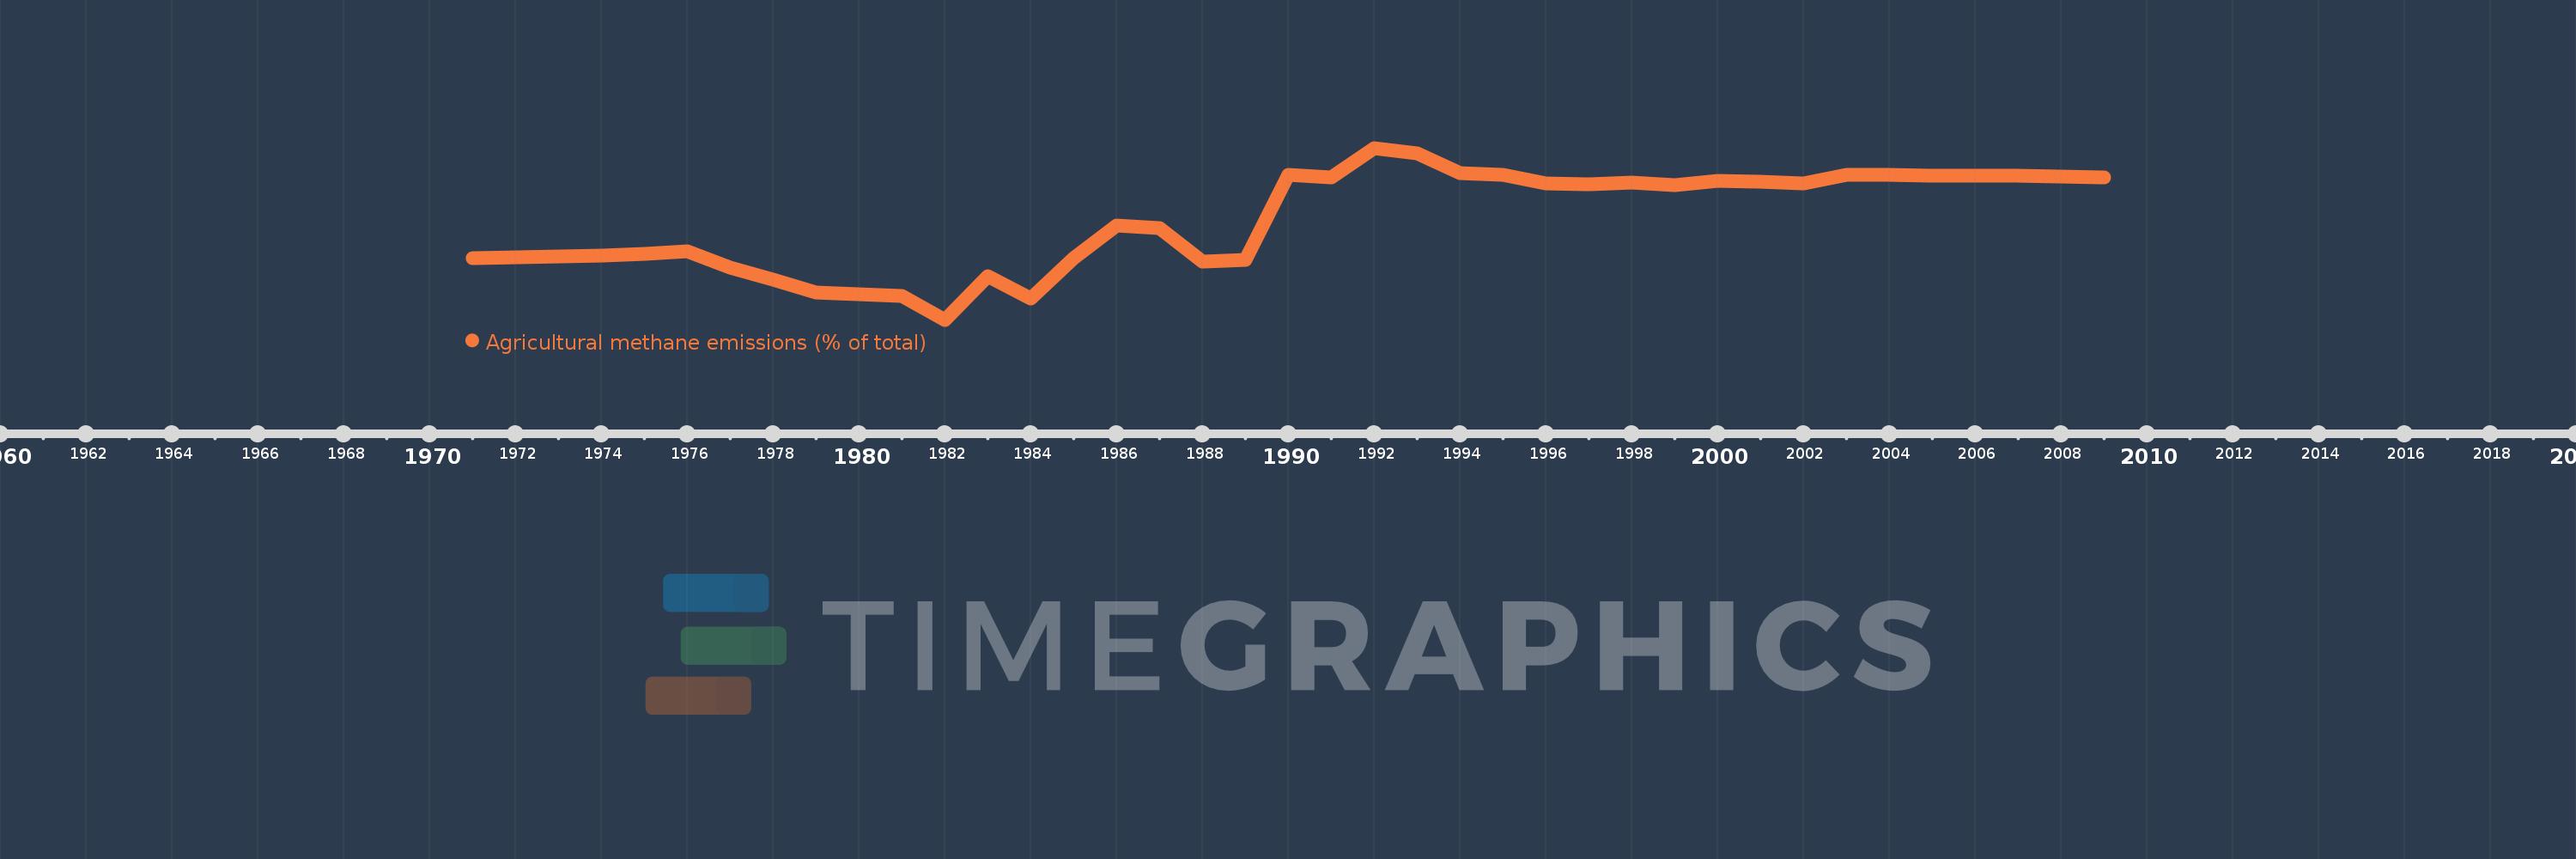
Agricultural methane emissions (% of total)
2009,2008,2007,2006,2005,2004,2003,2002,2001,2000,1999,1998,1997,1996,1995,1994,1993,1992,1991,1990,1989,1988,1987,1986,1985,1984,1983,1982,1981,1980,1979,1978,1977,1976,1975,1974,1973,1972,1971
This statistics in other country:
AfghanistanAlbaniaAlgeriaAmerican SamoaAngolaAntigua and BarbudaArab WorldArgentinaArmeniaArubaAustraliaAustriaAzerbaijanBahamas, TheBahrainBangladeshBarbadosBelarusBelgiumBelizeBeninBermudaBhutanBoliviaBosnia and HerzegovinaBotswanaBrazilBritish Virgin IslandsBrunei DarussalamBulgariaBurkina FasoBurundiCabo VerdeCambodiaCameroonCanadaCaribbean small statesCayman IslandsCentral African RepublicCentral Europe and the BalticsChadChileChinaColombiaComorosCongo, Dem. Rep.Congo, Rep.Costa RicaCote d'IvoireCroatiaCubaCyprusCzech RepublicDenmarkDjiboutiDominicaDominican RepublicEarly-demographic dividendEast Asia & PacificEast Asia & Pacific (excluding high income)East Asia & Pacific (IDA & IBRD countries)EcuadorEgypt, Arab Rep.El SalvadorEquatorial GuineaEritreaEstoniaEthiopiaEuro areaEurope & Central AsiaEurope & Central Asia (excluding high income)Europe & Central Asia (IDA & IBRD countries)European UnionFaroe IslandsFijiFinlandFragile and conflict affected situationsFranceFrench PolynesiaGabonGambia, TheGeorgiaGermanyGhanaGibraltarGreeceGreenlandGrenadaGuamGuatemalaGuineaGuinea-BissauGuyanaHaitiHeavily indebted poor countries (HIPC)High incomeHondurasHong Kong SAR, ChinaHungaryIBRD onlyIcelandIDA & IBRD totalIDA blendIDA onlyIDA totalIndiaIndonesiaIran, Islamic Rep.IraqIrelandIsraelItalyJamaicaJapanJordanKazakhstanKenyaKiribatiKorea, Dem. People’s Rep.Korea, Rep.KuwaitKyrgyz RepublicLao PDRLate-demographic dividendLatin America & Caribbean Latin America & Caribbean (excluding high income)Latin America & the Caribbean (IDA & IBRD countries)LatviaLeast developed countries: UN classificationLebanonLesothoLiberiaLibyaLithuaniaLow & middle incomeLow incomeLower middle incomeLuxembourgMacao SAR, ChinaMacedonia, FYRMadagascarMalawiMalaysiaMaldivesMaliMaltaMarshall IslandsMauritaniaMauritiusMexicoMicronesia, Fed. Sts.Middle East & North AfricaMiddle East & North Africa (excluding high income)Middle East & North Africa (IDA & IBRD countries)Middle incomeMoldovaMongoliaMoroccoMozambiqueMyanmarNamibiaNauruNepalNetherlandsNew CaledoniaNew ZealandNicaraguaNigerNigeriaNorth AmericaNorthern Mariana IslandsNorwayOECD membersOmanOther small statesPacific island small statesPakistanPalauPanamaPapua New GuineaParaguayPeruPhilippinesPolandPortugalPost-demographic dividendPre-demographic dividendPuerto RicoQatarRomaniaRussian FederationRwandaSamoaSao Tome and PrincipeSaudi ArabiaSenegalSerbiaSeychellesSierra LeoneSingaporeSlovak RepublicSloveniaSmall statesSolomon IslandsSomaliaSouth AfricaSouth AsiaSouth Asia (IDA & IBRD)SpainSri LankaSt. Kitts and NevisSt. LuciaSt. Vincent and the GrenadinesSub-Saharan Africa Sub-Saharan Africa (excluding high income)Sub-Saharan Africa (IDA & IBRD countries)SudanSurinameSwazilandSwedenSwitzerlandSyrian Arab RepublicTajikistanTanzaniaThailandTimor-LesteTogoTongaTrinidad and TobagoTunisiaTurkeyTurkmenistanTurks and Caicos IslandsTuvaluUgandaUkraineUnited Arab EmiratesUnited KingdomUnited StatesUpper middle incomeUruguayUzbekistanVanuatuVenezuela, RBVietnamVirgin Islands (U.S.)WorldYemen, Rep.ZambiaZimbabwe Timeline:
This timeline shows a graph from 1971 to 2009 of Tuvalu. No data until 1970. Number of actual observations by date: 39.
Source name:
World Development Indicators
Source organization:
World Bank staff estimates from original source: European Commission, Joint Research Centre (JRC)/Netherlands Environmental Assessment Agency (PBL). Emission Database for Global Atmospheric Research (EDGAR): http://edgar.jrc.ec.europa.eu/.
Categories, topics:
Agriculture & Rural Development, Environment
Last updated:
apr 23, 2017
Indicators value changes by year
Minimum:
24.229
jan 1, 1982
Maximum:
37.447
jan 1, 1992
At the date of observation
Value
Absolute change
Change from previous value
jan 1, 1971
28.966
+28.966
0.0%
jan 1, 1972
29.01
+0.044
0.15%
jan 1, 1973
29.067
+0.057
0.2%
jan 1, 1974
29.16
+0.093
0.32%
jan 1, 1975
29.304
+0.143
0.49%
jan 1, 1976
29.517
+0.213
0.73%
jan 1, 1977
28.225
-1.293
-4.38%
jan 1, 1978
27.342
-0.883
-3.13%
jan 1, 1979
26.339
-1.002
-3.67%
jan 1, 1980
26.208
-0.131
-0.5%
jan 1, 1981
26.045
-0.163
-0.62%
jan 1, 1982
24.229
-1.817
-6.97%
jan 1, 1983
27.559
+3.33
13.75%
jan 1, 1984
25.853
-1.706
-6.19%
jan 1, 1985
28.946
+3.093
11.96%
jan 1, 1986
31.471
+2.524
8.72%
jan 1, 1987
31.301
-0.17
-0.54%
jan 1, 1988
28.712
-2.589
-8.27%
jan 1, 1989
28.834
+0.122
0.43%
jan 1, 1990
35.354
+6.52
22.61%
jan 1, 1991
35.2
-0.155
-0.44%
jan 1, 1992
37.447
+2.247
6.38%
jan 1, 1993
37.008
-0.439
-1.17%
jan 1, 1994
35.524
-1.484
-4.01%
jan 1, 1995
35.347
-0.177
-0.5%
jan 1, 1996
34.707
-0.64
-1.81%
jan 1, 1997
34.658
-0.048
-0.14%
jan 1, 1998
34.792
+0.134
0.39%
jan 1, 1999
34.594
-0.198
-0.57%
jan 1, 2000
34.948
+0.355
1.03%
jan 1, 2001
34.841
-0.108
-0.31%
jan 1, 2002
34.736
-0.105
-0.3%
jan 1, 2003
35.374
+0.638
1.84%
jan 1, 2004
35.356
-0.018
-0.05%
jan 1, 2005
35.345
-0.011
-0.03%
jan 1, 2006
35.334
-0.011
-0.03%
jan 1, 2007
35.323
-0.011
-0.03%
jan 1, 2008
35.258
-0.065
-0.18%
jan 1, 2009
35.173
-0.085
-0.24%
Ranking of countries by current statistics by years


Comments: