29
/
en
AIzaSyAYiBZKx7MnpbEhh9jyipgxe19OcubqV5w
April 1, 2024
219288
Papua New Guinea
PNG
true
2
1
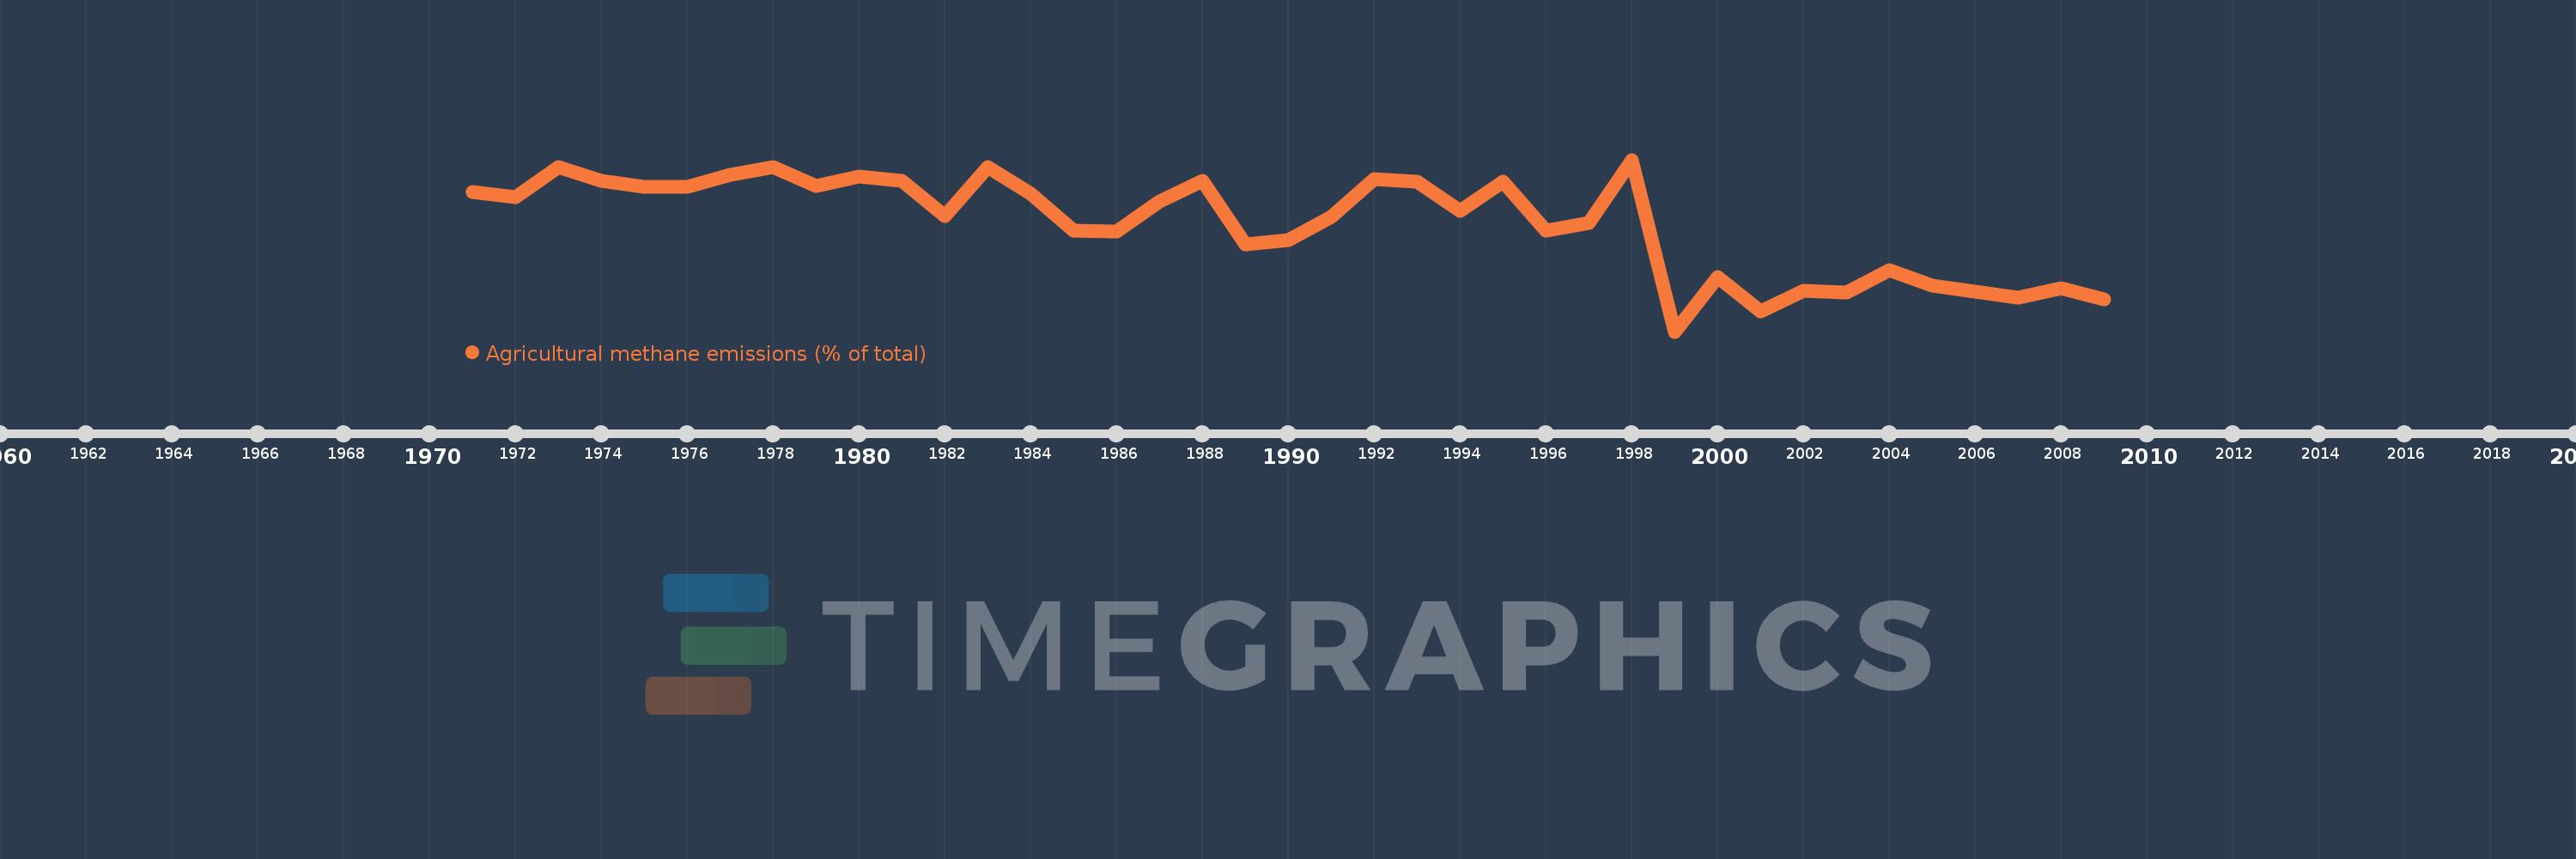
Agricultural methane emissions (% of total)
2009,2008,2007,2006,2005,2004,2003,2002,2001,2000,1999,1998,1997,1996,1995,1994,1993,1992,1991,1990,1989,1988,1987,1986,1985,1984,1983,1982,1981,1980,1979,1978,1977,1976,1975,1974,1973,1972,1971
This statistics in other country:
AfghanistanAlbaniaAlgeriaAmerican SamoaAngolaAntigua and BarbudaArab WorldArgentinaArmeniaArubaAustraliaAustriaAzerbaijanBahamas, TheBahrainBangladeshBarbadosBelarusBelgiumBelizeBeninBermudaBhutanBoliviaBosnia and HerzegovinaBotswanaBrazilBritish Virgin IslandsBrunei DarussalamBulgariaBurkina FasoBurundiCabo VerdeCambodiaCameroonCanadaCaribbean small statesCayman IslandsCentral African RepublicCentral Europe and the BalticsChadChileChinaColombiaComorosCongo, Dem. Rep.Congo, Rep.Costa RicaCote d'IvoireCroatiaCubaCyprusCzech RepublicDenmarkDjiboutiDominicaDominican RepublicEarly-demographic dividendEast Asia & PacificEast Asia & Pacific (excluding high income)East Asia & Pacific (IDA & IBRD countries)EcuadorEgypt, Arab Rep.El SalvadorEquatorial GuineaEritreaEstoniaEthiopiaEuro areaEurope & Central AsiaEurope & Central Asia (excluding high income)Europe & Central Asia (IDA & IBRD countries)European UnionFaroe IslandsFijiFinlandFragile and conflict affected situationsFranceFrench PolynesiaGabonGambia, TheGeorgiaGermanyGhanaGibraltarGreeceGreenlandGrenadaGuamGuatemalaGuineaGuinea-BissauGuyanaHaitiHeavily indebted poor countries (HIPC)High incomeHondurasHong Kong SAR, ChinaHungaryIBRD onlyIcelandIDA & IBRD totalIDA blendIDA onlyIDA totalIndiaIndonesiaIran, Islamic Rep.IraqIrelandIsraelItalyJamaicaJapanJordanKazakhstanKenyaKiribatiKorea, Dem. People’s Rep.Korea, Rep.KuwaitKyrgyz RepublicLao PDRLate-demographic dividendLatin America & Caribbean Latin America & Caribbean (excluding high income)Latin America & the Caribbean (IDA & IBRD countries)LatviaLeast developed countries: UN classificationLebanonLesothoLiberiaLibyaLithuaniaLow & middle incomeLow incomeLower middle incomeLuxembourgMacao SAR, ChinaMacedonia, FYRMadagascarMalawiMalaysiaMaldivesMaliMaltaMarshall IslandsMauritaniaMauritiusMexicoMicronesia, Fed. Sts.Middle East & North AfricaMiddle East & North Africa (excluding high income)Middle East & North Africa (IDA & IBRD countries)Middle incomeMoldovaMongoliaMoroccoMozambiqueMyanmarNamibiaNauruNepalNetherlandsNew CaledoniaNew ZealandNicaraguaNigerNigeriaNorth AmericaNorthern Mariana IslandsNorwayOECD membersOmanOther small statesPacific island small statesPakistanPalauPanamaPapua New GuineaParaguayPeruPhilippinesPolandPortugalPost-demographic dividendPre-demographic dividendPuerto RicoQatarRomaniaRussian FederationRwandaSamoaSao Tome and PrincipeSaudi ArabiaSenegalSerbiaSeychellesSierra LeoneSingaporeSlovak RepublicSloveniaSmall statesSolomon IslandsSomaliaSouth AfricaSouth AsiaSouth Asia (IDA & IBRD)SpainSri LankaSt. Kitts and NevisSt. LuciaSt. Vincent and the GrenadinesSub-Saharan Africa Sub-Saharan Africa (excluding high income)Sub-Saharan Africa (IDA & IBRD countries)SudanSurinameSwazilandSwedenSwitzerlandSyrian Arab RepublicTajikistanTanzaniaThailandTimor-LesteTogoTongaTrinidad and TobagoTunisiaTurkeyTurkmenistanTurks and Caicos IslandsTuvaluUgandaUkraineUnited Arab EmiratesUnited KingdomUnited StatesUpper middle incomeUruguayUzbekistanVanuatuVenezuela, RBVietnamVirgin Islands (U.S.)WorldYemen, Rep.ZambiaZimbabwe Timeline:
This timeline shows a graph from 1971 to 2009 of Papua New Guinea. No data until 1970. Number of actual observations by date: 39.
Source name:
World Development Indicators
Source organization:
World Bank staff estimates from original source: European Commission, Joint Research Centre (JRC)/Netherlands Environmental Assessment Agency (PBL). Emission Database for Global Atmospheric Research (EDGAR): http://edgar.jrc.ec.europa.eu/.
Categories, topics:
Agriculture & Rural Development, Environment
Last updated:
apr 23, 2017
Indicators value changes by year
Minimum:
11.022
jan 1, 1999
Maximum:
32.749
jan 1, 1998
At the date of observation
Value
Absolute change
Change from previous value
jan 1, 1971
28.668
+28.668
0.0%
jan 1, 1972
28.058
-0.61
-2.13%
jan 1, 1973
31.809
+3.75
13.37%
jan 1, 1974
30.061
-1.747
-5.49%
jan 1, 1975
29.373
-0.689
-2.29%
jan 1, 1976
29.344
-0.029
-0.1%
jan 1, 1977
30.822
+1.478
5.04%
jan 1, 1978
31.874
+1.052
3.41%
jan 1, 1979
29.432
-2.442
-7.66%
jan 1, 1980
30.583
+1.151
3.91%
jan 1, 1981
30.073
-0.51
-1.67%
jan 1, 1982
25.587
-4.486
-14.92%
jan 1, 1983
31.846
+6.259
24.46%
jan 1, 1984
28.505
-3.341
-10.49%
jan 1, 1985
23.754
-4.751
-16.67%
jan 1, 1986
23.651
-0.102
-0.43%
jan 1, 1987
27.47
+3.818
16.14%
jan 1, 1988
30.085
+2.615
9.52%
jan 1, 1989
22.062
-8.023
-26.67%
jan 1, 1990
22.545
+0.483
2.19%
jan 1, 1991
25.567
+3.022
13.4%
jan 1, 1992
30.267
+4.7
18.38%
jan 1, 1993
29.947
-0.32
-1.06%
jan 1, 1994
26.284
-3.663
-12.23%
jan 1, 1995
29.974
+3.69
14.04%
jan 1, 1996
23.754
-6.22
-20.75%
jan 1, 1997
24.778
+1.025
4.31%
jan 1, 1998
32.749
+7.971
32.17%
jan 1, 1999
11.022
-21.727
-66.34%
jan 1, 2000
17.953
+6.931
62.88%
jan 1, 2001
13.532
-4.42
-24.62%
jan 1, 2002
16.161
+2.629
19.43%
jan 1, 2003
15.994
-0.167
-1.03%
jan 1, 2004
18.837
+2.842
17.77%
jan 1, 2005
16.871
-1.966
-10.44%
jan 1, 2006
16.113
-0.758
-4.49%
jan 1, 2007
15.3
-0.813
-5.04%
jan 1, 2008
16.551
+1.251
8.17%
jan 1, 2009
15.045
-1.506
-9.1%
Ranking of countries by current statistics by years


Comments: