29
/
en
AIzaSyAYiBZKx7MnpbEhh9jyipgxe19OcubqV5w
April 1, 2024
34029
Fragile and conflict affected situations
FCS
false
2
1
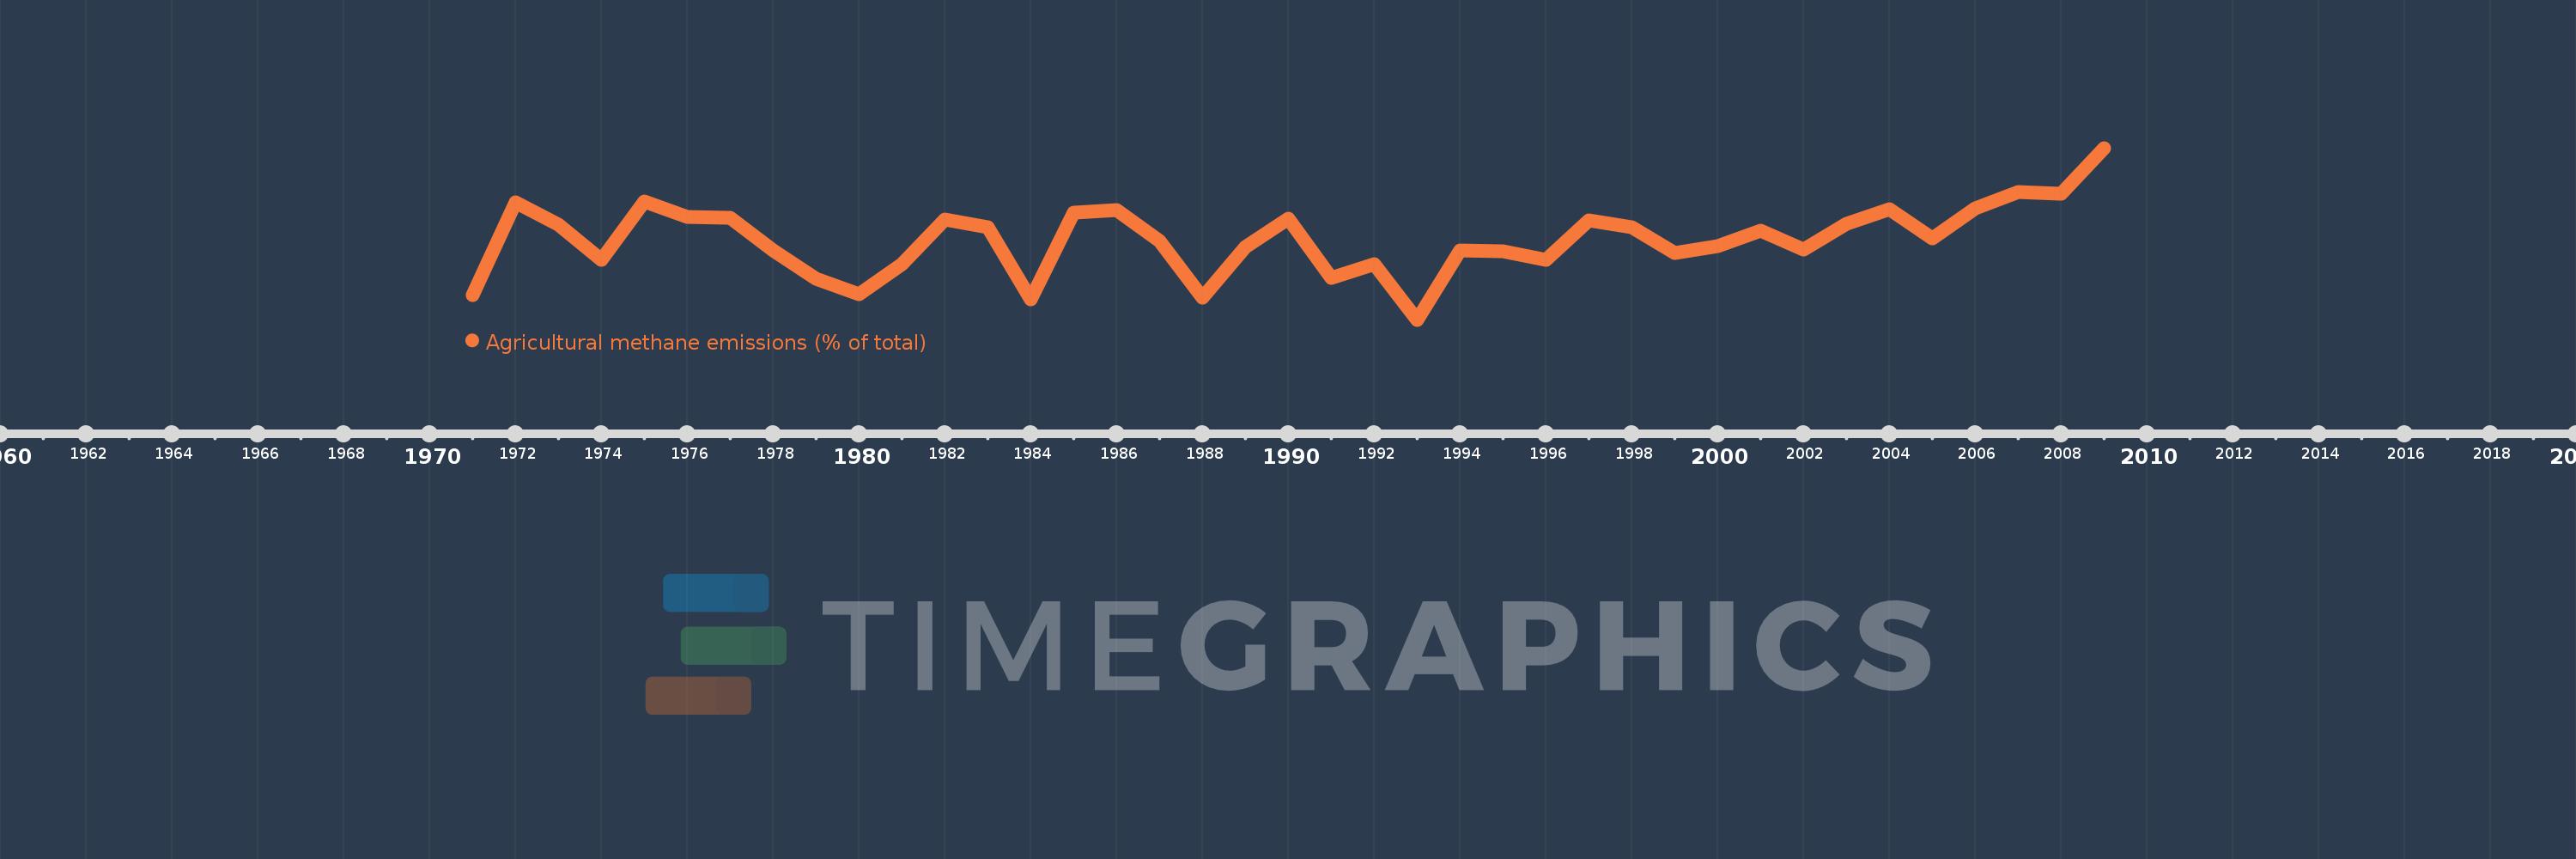
Agricultural methane emissions (% of total)
2009,2008,2007,2006,2005,2004,2003,2002,2001,2000,1999,1998,1997,1996,1995,1994,1993,1992,1991,1990,1989,1988,1987,1986,1985,1984,1983,1982,1981,1980,1979,1978,1977,1976,1975,1974,1973,1972,1971
This statistics in other country:
AfghanistanAlbaniaAlgeriaAmerican SamoaAngolaAntigua and BarbudaArab WorldArgentinaArmeniaArubaAustraliaAustriaAzerbaijanBahamas, TheBahrainBangladeshBarbadosBelarusBelgiumBelizeBeninBermudaBhutanBoliviaBosnia and HerzegovinaBotswanaBrazilBritish Virgin IslandsBrunei DarussalamBulgariaBurkina FasoBurundiCabo VerdeCambodiaCameroonCanadaCaribbean small statesCayman IslandsCentral African RepublicCentral Europe and the BalticsChadChileChinaColombiaComorosCongo, Dem. Rep.Congo, Rep.Costa RicaCote d'IvoireCroatiaCubaCyprusCzech RepublicDenmarkDjiboutiDominicaDominican RepublicEarly-demographic dividendEast Asia & PacificEast Asia & Pacific (excluding high income)East Asia & Pacific (IDA & IBRD countries)EcuadorEgypt, Arab Rep.El SalvadorEquatorial GuineaEritreaEstoniaEthiopiaEuro areaEurope & Central AsiaEurope & Central Asia (excluding high income)Europe & Central Asia (IDA & IBRD countries)European UnionFaroe IslandsFijiFinlandFragile and conflict affected situationsFranceFrench PolynesiaGabonGambia, TheGeorgiaGermanyGhanaGibraltarGreeceGreenlandGrenadaGuamGuatemalaGuineaGuinea-BissauGuyanaHaitiHeavily indebted poor countries (HIPC)High incomeHondurasHong Kong SAR, ChinaHungaryIBRD onlyIcelandIDA & IBRD totalIDA blendIDA onlyIDA totalIndiaIndonesiaIran, Islamic Rep.IraqIrelandIsraelItalyJamaicaJapanJordanKazakhstanKenyaKiribatiKorea, Dem. People’s Rep.Korea, Rep.KuwaitKyrgyz RepublicLao PDRLate-demographic dividendLatin America & Caribbean Latin America & Caribbean (excluding high income)Latin America & the Caribbean (IDA & IBRD countries)LatviaLeast developed countries: UN classificationLebanonLesothoLiberiaLibyaLithuaniaLow & middle incomeLow incomeLower middle incomeLuxembourgMacao SAR, ChinaMacedonia, FYRMadagascarMalawiMalaysiaMaldivesMaliMaltaMarshall IslandsMauritaniaMauritiusMexicoMicronesia, Fed. Sts.Middle East & North AfricaMiddle East & North Africa (excluding high income)Middle East & North Africa (IDA & IBRD countries)Middle incomeMoldovaMongoliaMoroccoMozambiqueMyanmarNamibiaNauruNepalNetherlandsNew CaledoniaNew ZealandNicaraguaNigerNigeriaNorth AmericaNorthern Mariana IslandsNorwayOECD membersOmanOther small statesPacific island small statesPakistanPalauPanamaPapua New GuineaParaguayPeruPhilippinesPolandPortugalPost-demographic dividendPre-demographic dividendPuerto RicoQatarRomaniaRussian FederationRwandaSamoaSao Tome and PrincipeSaudi ArabiaSenegalSerbiaSeychellesSierra LeoneSingaporeSlovak RepublicSloveniaSmall statesSolomon IslandsSomaliaSouth AfricaSouth AsiaSouth Asia (IDA & IBRD)SpainSri LankaSt. Kitts and NevisSt. LuciaSt. Vincent and the GrenadinesSub-Saharan Africa Sub-Saharan Africa (excluding high income)Sub-Saharan Africa (IDA & IBRD countries)SudanSurinameSwazilandSwedenSwitzerlandSyrian Arab RepublicTajikistanTanzaniaThailandTimor-LesteTogoTongaTrinidad and TobagoTunisiaTurkeyTurkmenistanTurks and Caicos IslandsTuvaluUgandaUkraineUnited Arab EmiratesUnited KingdomUnited StatesUpper middle incomeUruguayUzbekistanVanuatuVenezuela, RBVietnamVirgin Islands (U.S.)WorldYemen, Rep.ZambiaZimbabwe Timeline:
This timeline shows a graph from 1971 to 2009 of Fragile and conflict affected situations. No data until 1970. Number of actual observations by date: 39.
Source name:
World Development Indicators
Source organization:
World Bank staff estimates from original source: European Commission, Joint Research Centre (JRC)/Netherlands Environmental Assessment Agency (PBL). Emission Database for Global Atmospheric Research (EDGAR): http://edgar.jrc.ec.europa.eu/.
Categories, topics:
Agriculture & Rural Development, Environment
Last updated:
apr 23, 2017
Indicators value changes by year
Minimum:
46.986
jan 1, 1993
Maximum:
62.137
jan 1, 2009
At the date of observation
Value
Absolute change
Change from previous value
jan 1, 1971
49.181
+49.181
0.0%
jan 1, 1972
57.306
+8.126
16.52%
jan 1, 1973
55.355
-1.951
-3.41%
jan 1, 1974
52.252
-3.103
-5.61%
jan 1, 1975
57.409
+5.157
9.87%
jan 1, 1976
56.091
-1.318
-2.3%
jan 1, 1977
55.982
-0.109
-0.19%
jan 1, 1978
53.084
-2.898
-5.18%
jan 1, 1979
50.573
-2.512
-4.73%
jan 1, 1980
49.227
-1.346
-2.66%
jan 1, 1981
51.856
+2.629
5.34%
jan 1, 1982
55.808
+3.952
7.62%
jan 1, 1983
55.159
-0.649
-1.16%
jan 1, 1984
48.749
-6.41
-11.62%
jan 1, 1985
56.425
+7.676
15.75%
jan 1, 1986
56.67
+0.245
0.43%
jan 1, 1987
53.954
-2.716
-4.79%
jan 1, 1988
48.939
-5.016
-9.3%
jan 1, 1989
53.424
+4.485
9.17%
jan 1, 1990
55.87
+2.446
4.58%
jan 1, 1991
50.663
-5.207
-9.32%
jan 1, 1992
51.914
+1.251
2.47%
jan 1, 1993
46.986
-4.928
-9.49%
jan 1, 1994
53.081
+6.095
12.97%
jan 1, 1995
53.047
-0.033
-0.06%
jan 1, 1996
52.289
-0.758
-1.43%
jan 1, 1997
55.768
+3.479
6.65%
jan 1, 1998
55.134
-0.634
-1.14%
jan 1, 1999
52.859
-2.275
-4.13%
jan 1, 2000
53.477
+0.618
1.17%
jan 1, 2001
54.823
+1.347
2.52%
jan 1, 2002
53.15
-1.673
-3.05%
jan 1, 2003
55.421
+2.27
4.27%
jan 1, 2004
56.764
+1.343
2.42%
jan 1, 2005
54.137
-2.627
-4.63%
jan 1, 2006
56.842
+2.705
5.0%
jan 1, 2007
58.23
+1.389
2.44%
jan 1, 2008
58.137
-0.094
-0.16%
jan 1, 2009
62.137
+4.0
6.88%
Ranking of countries by current statistics by years


Comments: