29
/
en
AIzaSyAYiBZKx7MnpbEhh9jyipgxe19OcubqV5w
April 1, 2024
159134
Ireland
IRL
true
2
1
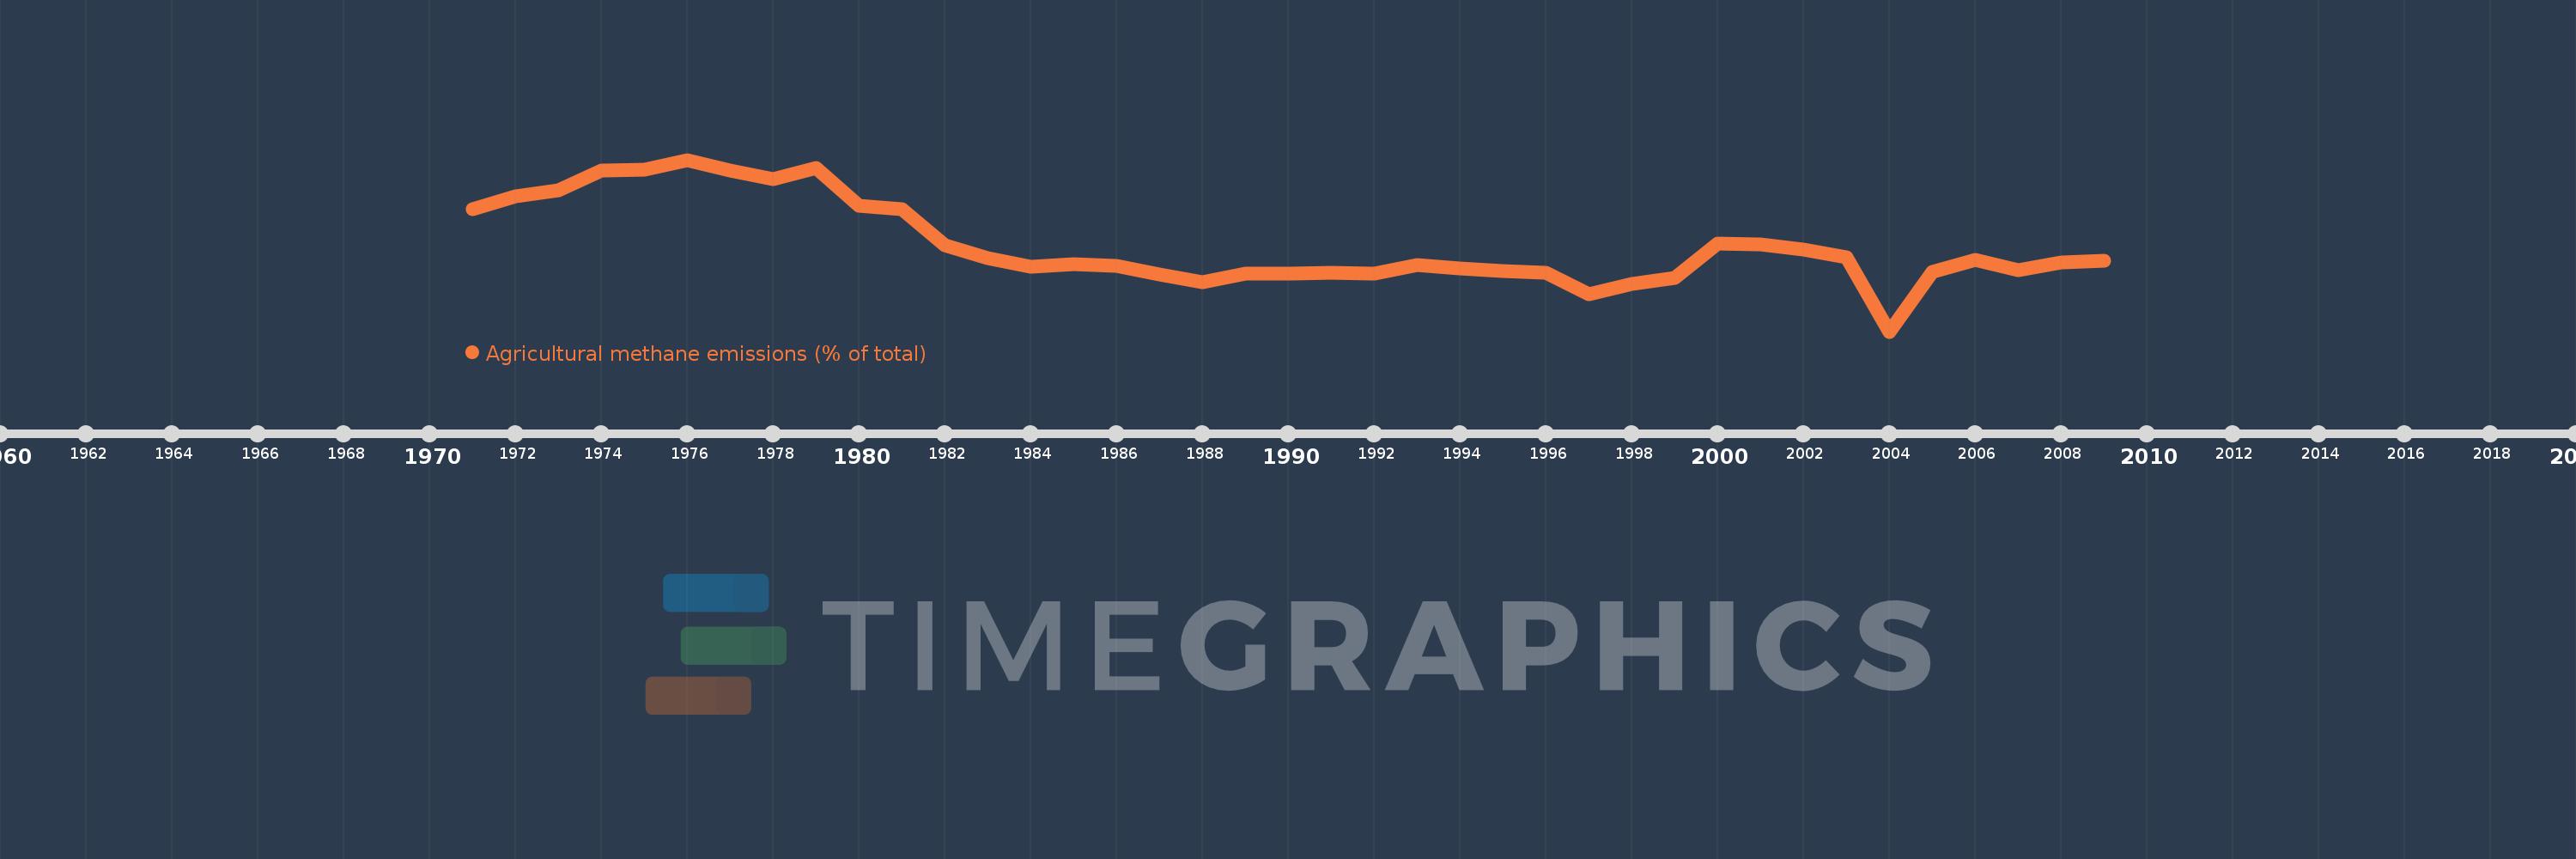
Agricultural methane emissions (% of total)
2009,2008,2007,2006,2005,2004,2003,2002,2001,2000,1999,1998,1997,1996,1995,1994,1993,1992,1991,1990,1989,1988,1987,1986,1985,1984,1983,1982,1981,1980,1979,1978,1977,1976,1975,1974,1973,1972,1971
This statistics in other country:
AfghanistanAlbaniaAlgeriaAmerican SamoaAngolaAntigua and BarbudaArab WorldArgentinaArmeniaArubaAustraliaAustriaAzerbaijanBahamas, TheBahrainBangladeshBarbadosBelarusBelgiumBelizeBeninBermudaBhutanBoliviaBosnia and HerzegovinaBotswanaBrazilBritish Virgin IslandsBrunei DarussalamBulgariaBurkina FasoBurundiCabo VerdeCambodiaCameroonCanadaCaribbean small statesCayman IslandsCentral African RepublicCentral Europe and the BalticsChadChileChinaColombiaComorosCongo, Dem. Rep.Congo, Rep.Costa RicaCote d'IvoireCroatiaCubaCyprusCzech RepublicDenmarkDjiboutiDominicaDominican RepublicEarly-demographic dividendEast Asia & PacificEast Asia & Pacific (excluding high income)East Asia & Pacific (IDA & IBRD countries)EcuadorEgypt, Arab Rep.El SalvadorEquatorial GuineaEritreaEstoniaEthiopiaEuro areaEurope & Central AsiaEurope & Central Asia (excluding high income)Europe & Central Asia (IDA & IBRD countries)European UnionFaroe IslandsFijiFinlandFragile and conflict affected situationsFranceFrench PolynesiaGabonGambia, TheGeorgiaGermanyGhanaGibraltarGreeceGreenlandGrenadaGuamGuatemalaGuineaGuinea-BissauGuyanaHaitiHeavily indebted poor countries (HIPC)High incomeHondurasHong Kong SAR, ChinaHungaryIBRD onlyIcelandIDA & IBRD totalIDA blendIDA onlyIDA totalIndiaIndonesiaIran, Islamic Rep.IraqIrelandIsraelItalyJamaicaJapanJordanKazakhstanKenyaKiribatiKorea, Dem. People’s Rep.Korea, Rep.KuwaitKyrgyz RepublicLao PDRLate-demographic dividendLatin America & Caribbean Latin America & Caribbean (excluding high income)Latin America & the Caribbean (IDA & IBRD countries)LatviaLeast developed countries: UN classificationLebanonLesothoLiberiaLibyaLithuaniaLow & middle incomeLow incomeLower middle incomeLuxembourgMacao SAR, ChinaMacedonia, FYRMadagascarMalawiMalaysiaMaldivesMaliMaltaMarshall IslandsMauritaniaMauritiusMexicoMicronesia, Fed. Sts.Middle East & North AfricaMiddle East & North Africa (excluding high income)Middle East & North Africa (IDA & IBRD countries)Middle incomeMoldovaMongoliaMoroccoMozambiqueMyanmarNamibiaNauruNepalNetherlandsNew CaledoniaNew ZealandNicaraguaNigerNigeriaNorth AmericaNorthern Mariana IslandsNorwayOECD membersOmanOther small statesPacific island small statesPakistanPalauPanamaPapua New GuineaParaguayPeruPhilippinesPolandPortugalPost-demographic dividendPre-demographic dividendPuerto RicoQatarRomaniaRussian FederationRwandaSamoaSao Tome and PrincipeSaudi ArabiaSenegalSerbiaSeychellesSierra LeoneSingaporeSlovak RepublicSloveniaSmall statesSolomon IslandsSomaliaSouth AfricaSouth AsiaSouth Asia (IDA & IBRD)SpainSri LankaSt. Kitts and NevisSt. LuciaSt. Vincent and the GrenadinesSub-Saharan Africa Sub-Saharan Africa (excluding high income)Sub-Saharan Africa (IDA & IBRD countries)SudanSurinameSwazilandSwedenSwitzerlandSyrian Arab RepublicTajikistanTanzaniaThailandTimor-LesteTogoTongaTrinidad and TobagoTunisiaTurkeyTurkmenistanTurks and Caicos IslandsTuvaluUgandaUkraineUnited Arab EmiratesUnited KingdomUnited StatesUpper middle incomeUruguayUzbekistanVanuatuVenezuela, RBVietnamVirgin Islands (U.S.)WorldYemen, Rep.ZambiaZimbabwe Timeline:
This timeline shows a graph from 1971 to 2009 of Ireland. No data until 1970. Number of actual observations by date: 39.
Source name:
World Development Indicators
Source organization:
World Bank staff estimates from original source: European Commission, Joint Research Centre (JRC)/Netherlands Environmental Assessment Agency (PBL). Emission Database for Global Atmospheric Research (EDGAR): http://edgar.jrc.ec.europa.eu/.
Categories, topics:
Agriculture & Rural Development, Environment
Last updated:
apr 23, 2017
Indicators value changes by year
Minimum:
74.433
jan 1, 2004
Maximum:
84.436
jan 1, 1976
At the date of observation
Value
Absolute change
Change from previous value
jan 1, 1971
81.56
+81.56
0.0%
jan 1, 1972
82.306
+0.746
0.92%
jan 1, 1973
82.644
+0.338
0.41%
jan 1, 1974
83.821
+1.177
1.42%
jan 1, 1975
83.872
+0.052
0.06%
jan 1, 1976
84.436
+0.563
0.67%
jan 1, 1977
83.835
-0.601
-0.71%
jan 1, 1978
83.322
-0.513
-0.61%
jan 1, 1979
83.952
+0.63
0.76%
jan 1, 1980
81.777
-2.175
-2.59%
jan 1, 1981
81.554
-0.224
-0.27%
jan 1, 1982
79.454
-2.099
-2.57%
jan 1, 1983
78.715
-0.739
-0.93%
jan 1, 1984
78.227
-0.488
-0.62%
jan 1, 1985
78.358
+0.131
0.17%
jan 1, 1986
78.249
-0.109
-0.14%
jan 1, 1987
77.776
-0.473
-0.6%
jan 1, 1988
77.315
-0.461
-0.59%
jan 1, 1989
77.796
+0.481
0.62%
jan 1, 1990
77.819
+0.024
0.03%
jan 1, 1991
77.843
+0.024
0.03%
jan 1, 1992
77.803
-0.04
-0.05%
jan 1, 1993
78.292
+0.489
0.63%
jan 1, 1994
78.103
-0.189
-0.24%
jan 1, 1995
77.945
-0.159
-0.2%
jan 1, 1996
77.852
-0.093
-0.12%
jan 1, 1997
76.606
-1.246
-1.6%
jan 1, 1998
77.211
+0.606
0.79%
jan 1, 1999
77.56
+0.348
0.45%
jan 1, 2000
79.548
+1.989
2.56%
jan 1, 2001
79.488
-0.06
-0.08%
jan 1, 2002
79.192
-0.297
-0.37%
jan 1, 2003
78.748
-0.444
-0.56%
jan 1, 2004
74.433
-4.315
-5.48%
jan 1, 2005
77.885
+3.452
4.64%
jan 1, 2006
78.611
+0.726
0.93%
jan 1, 2007
77.992
-0.619
-0.79%
jan 1, 2008
78.466
+0.473
0.61%
jan 1, 2009
78.557
+0.092
0.12%
Ranking of countries by current statistics by years


Comments: