29
/
en
AIzaSyAYiBZKx7MnpbEhh9jyipgxe19OcubqV5w
April 1, 2024
108198
Comoros
COM
true
2
1
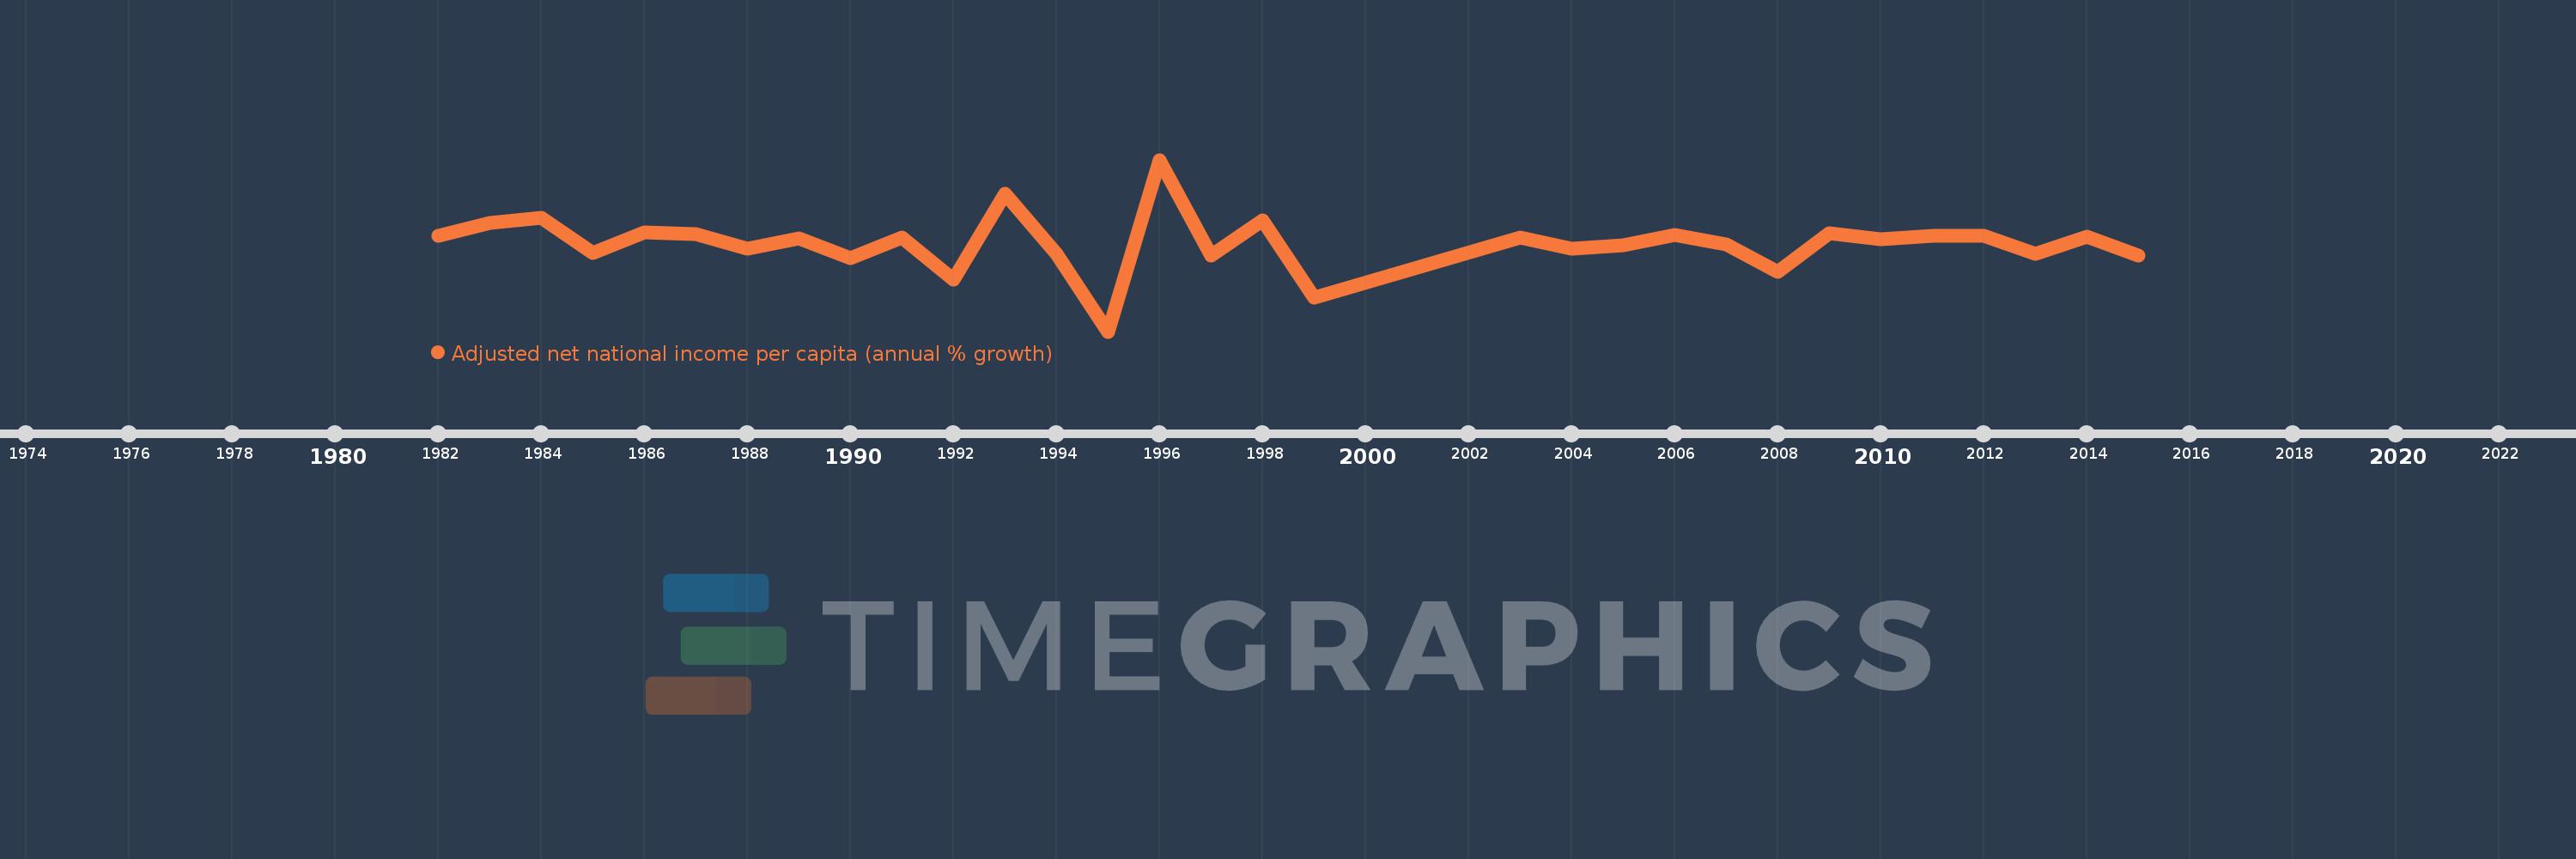
Adjusted net national income per capita (annual % growth)
2015,2014,2013,2012,2011,2010,2009,2008,2007,2006,2005,2004,2003,1999,1998,1997,1996,1995,1994,1993,1992,1991,1990,1989,1988,1987,1986,1985,1984,1983,1982
This statistics in other country:
Timeline:
This timeline shows a graph from 1982 to 2015 of Comoros. No data until 1981. Number of actual observations by date: 31.
Source name:
World Development Indicators
Source organization:
World Bank staff estimates based on sources and methods in World Bank's "The Changing Wealth of Nations: Measuring Sustainable Development in the New Millennium" (2011).
Categories, topics:
Economy & Growth
Last updated:
apr 23, 2017
Indicators value changes by year
Minimum:
-19.228
jan 1, 1995
Maximum:
15.734
jan 1, 1996
At the date of observation
Value
Absolute change
Change from previous value
jan 1, 1982
0.327
+0.327
0.0%
jan 1, 1983
2.928
+2.601
794.64%
jan 1, 1984
3.978
+1.05
35.85%
jan 1, 1985
-3.191
-7.17
-180.22%
jan 1, 1986
0.975
+4.166
-130.54%
jan 1, 1987
0.563
-0.412
-42.24%
jan 1, 1988
-2.352
-2.915
-517.84%
jan 1, 1989
-0.209
+2.143
-91.11%
jan 1, 1990
-4.329
-4.12
1.97K%
jan 1, 1991
-0.087
+4.242
-97.99%
jan 1, 1992
-8.672
-8.585
9.87K%
jan 1, 1993
8.858
+17.53
-202.14%
jan 1, 1994
-3.49
-12.348
-139.4%
jan 1, 1995
-19.228
-15.738
450.98%
jan 1, 1996
15.734
+34.961
-181.83%
jan 1, 1997
-3.696
-19.43
-123.49%
jan 1, 1998
3.488
+7.184
-194.39%
jan 1, 1999
-12.385
-15.873
-455.01%
jan 1, 2003
-0.141
+12.243
-98.86%
jan 1, 2004
-2.284
-2.143
1.52K%
jan 1, 2005
-1.582
+0.702
-30.74%
jan 1, 2006
0.484
+2.066
-130.59%
jan 1, 2007
-1.521
-2.005
-414.33%
jan 1, 2008
-7.073
-5.551
364.88%
jan 1, 2009
0.72
+7.792
-110.17%
jan 1, 2010
-0.456
-1.175
-163.33%
jan 1, 2011
0.218
+0.673
-147.78%
jan 1, 2012
0.189
-0.028
-13.01%
jan 1, 2013
-3.44
-3.63
-1.92K%
jan 1, 2014
0.044
+3.484
-101.27%
jan 1, 2015
-3.75
-3.794
-8.71K%
Ranking of countries by current statistics by years


Comments: