29
/
en
AIzaSyAYiBZKx7MnpbEhh9jyipgxe19OcubqV5w
April 1, 2024
172380
Kyrgyz Republic
KGZ
true
2
1
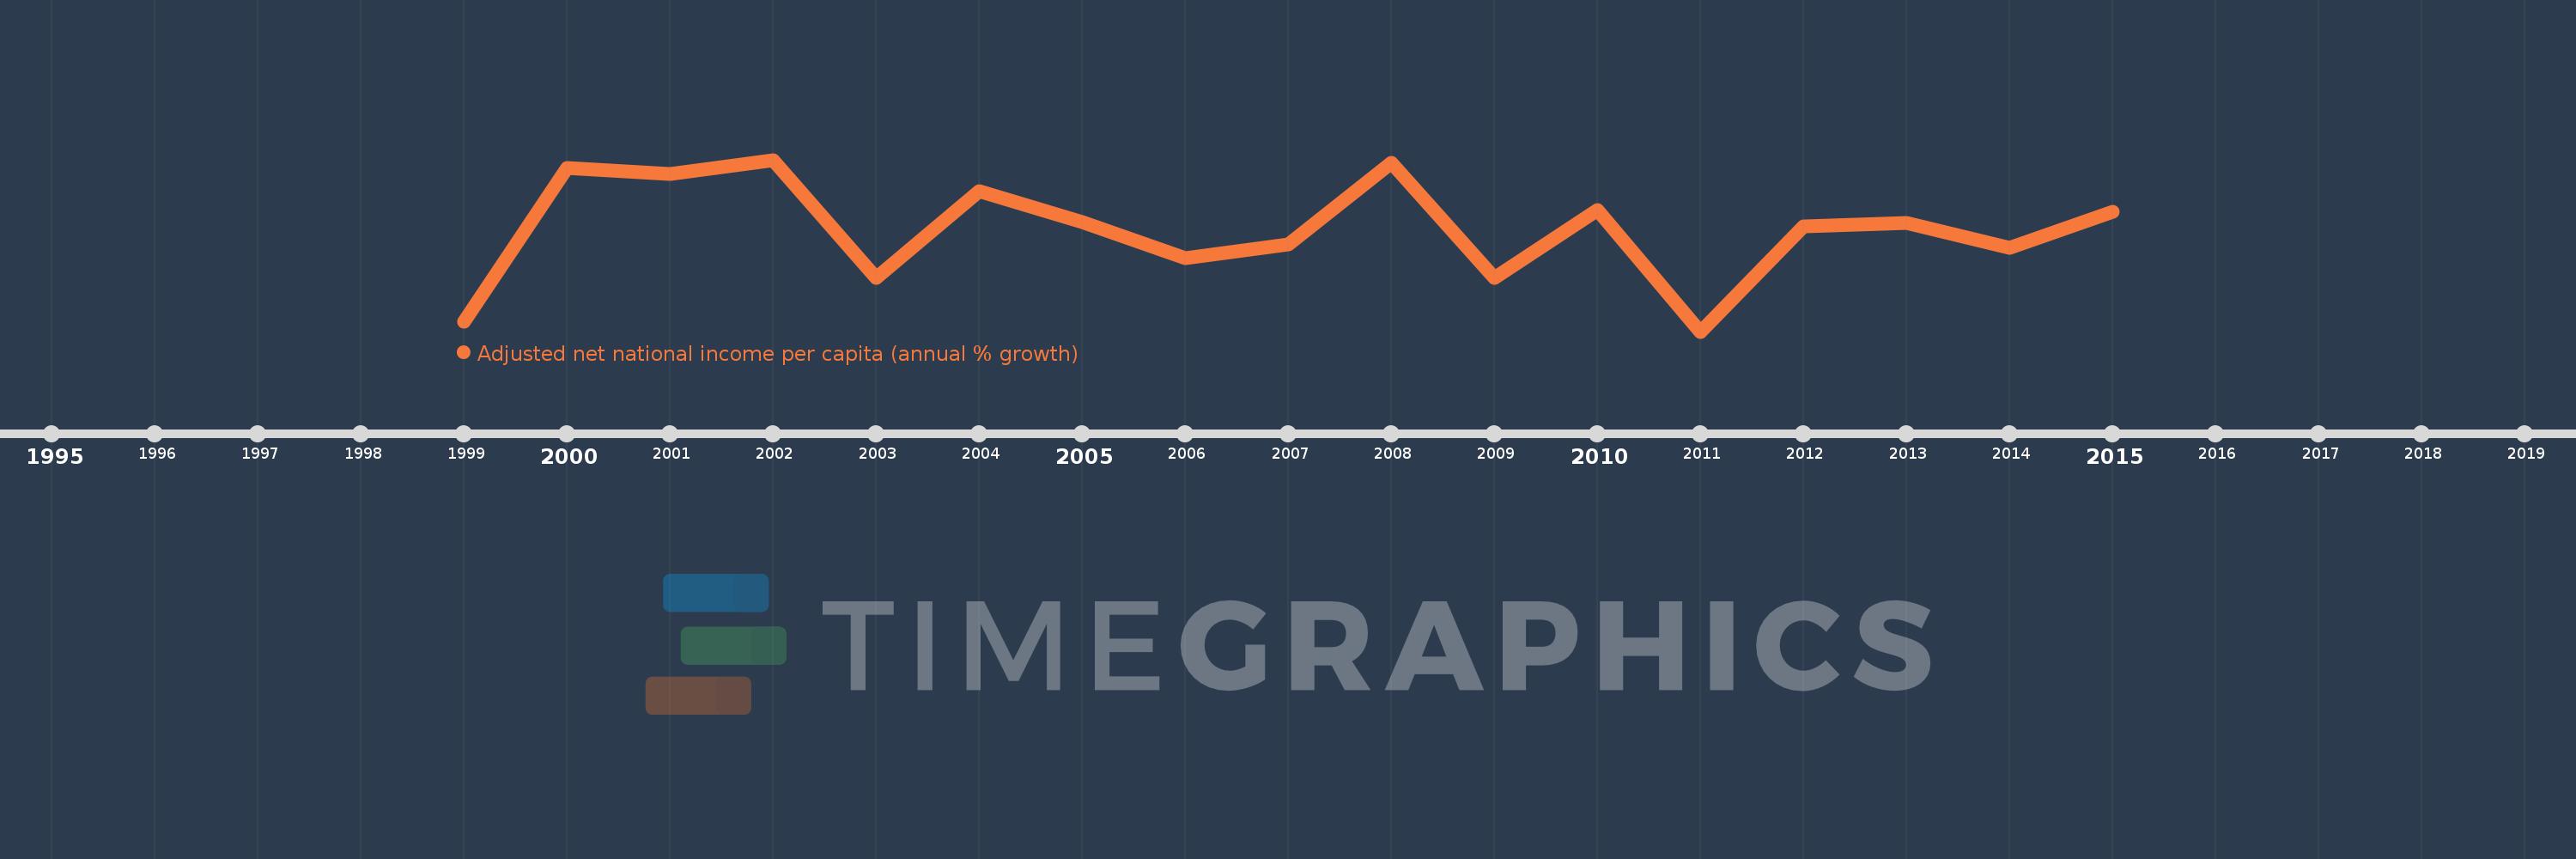
Adjusted net national income per capita (annual % growth)
2015,2014,2013,2012,2011,2010,2009,2008,2007,2006,2005,2004,2003,2002,2001,2000,1999
This statistics in other country:
Timeline:
This timeline shows a graph from 1999 to 2015 of Kyrgyz Republic. No data until 1998. Number of actual observations by date: 17.
Source name:
World Development Indicators
Source organization:
World Bank staff estimates based on sources and methods in World Bank's "The Changing Wealth of Nations: Measuring Sustainable Development in the New Millennium" (2011).
Categories, topics:
Economy & Growth
Last updated:
apr 23, 2017
Indicators value changes by year
Minimum:
-12.087
jan 1, 2011
At the date of observation
Value
Absolute change
Change from previous value
jan 1, 1999
-10.709
-10.709
0.0%
jan 1, 2000
10.211
+20.92
-195.35%
jan 1, 2001
9.413
-0.798
-7.81%
jan 1, 2002
11.35
+1.936
20.57%
jan 1, 2003
-4.76
-16.11
-141.94%
jan 1, 2004
7.04
+11.801
-247.89%
jan 1, 2005
2.86
-4.18
-59.38%
jan 1, 2006
-2.085
-4.945
-172.91%
jan 1, 2007
-0.143
+1.942
-93.14%
jan 1, 2008
10.981
+11.124
-7.77K%
jan 1, 2009
-4.753
-15.734
-143.28%
jan 1, 2010
4.523
+9.276
-195.17%
jan 1, 2011
-12.087
-16.61
-367.2%
jan 1, 2012
2.221
+14.307
-118.37%
jan 1, 2013
2.794
+0.573
25.8%
jan 1, 2014
-0.609
-3.403
-121.82%
jan 1, 2015
4.304
+4.913
-806.16%
Ranking of countries by current statistics by years


Comments: