29
/
en
AIzaSyAYiBZKx7MnpbEhh9jyipgxe19OcubqV5w
April 1, 2024
76814
Bahrain
BHR
true
2
1
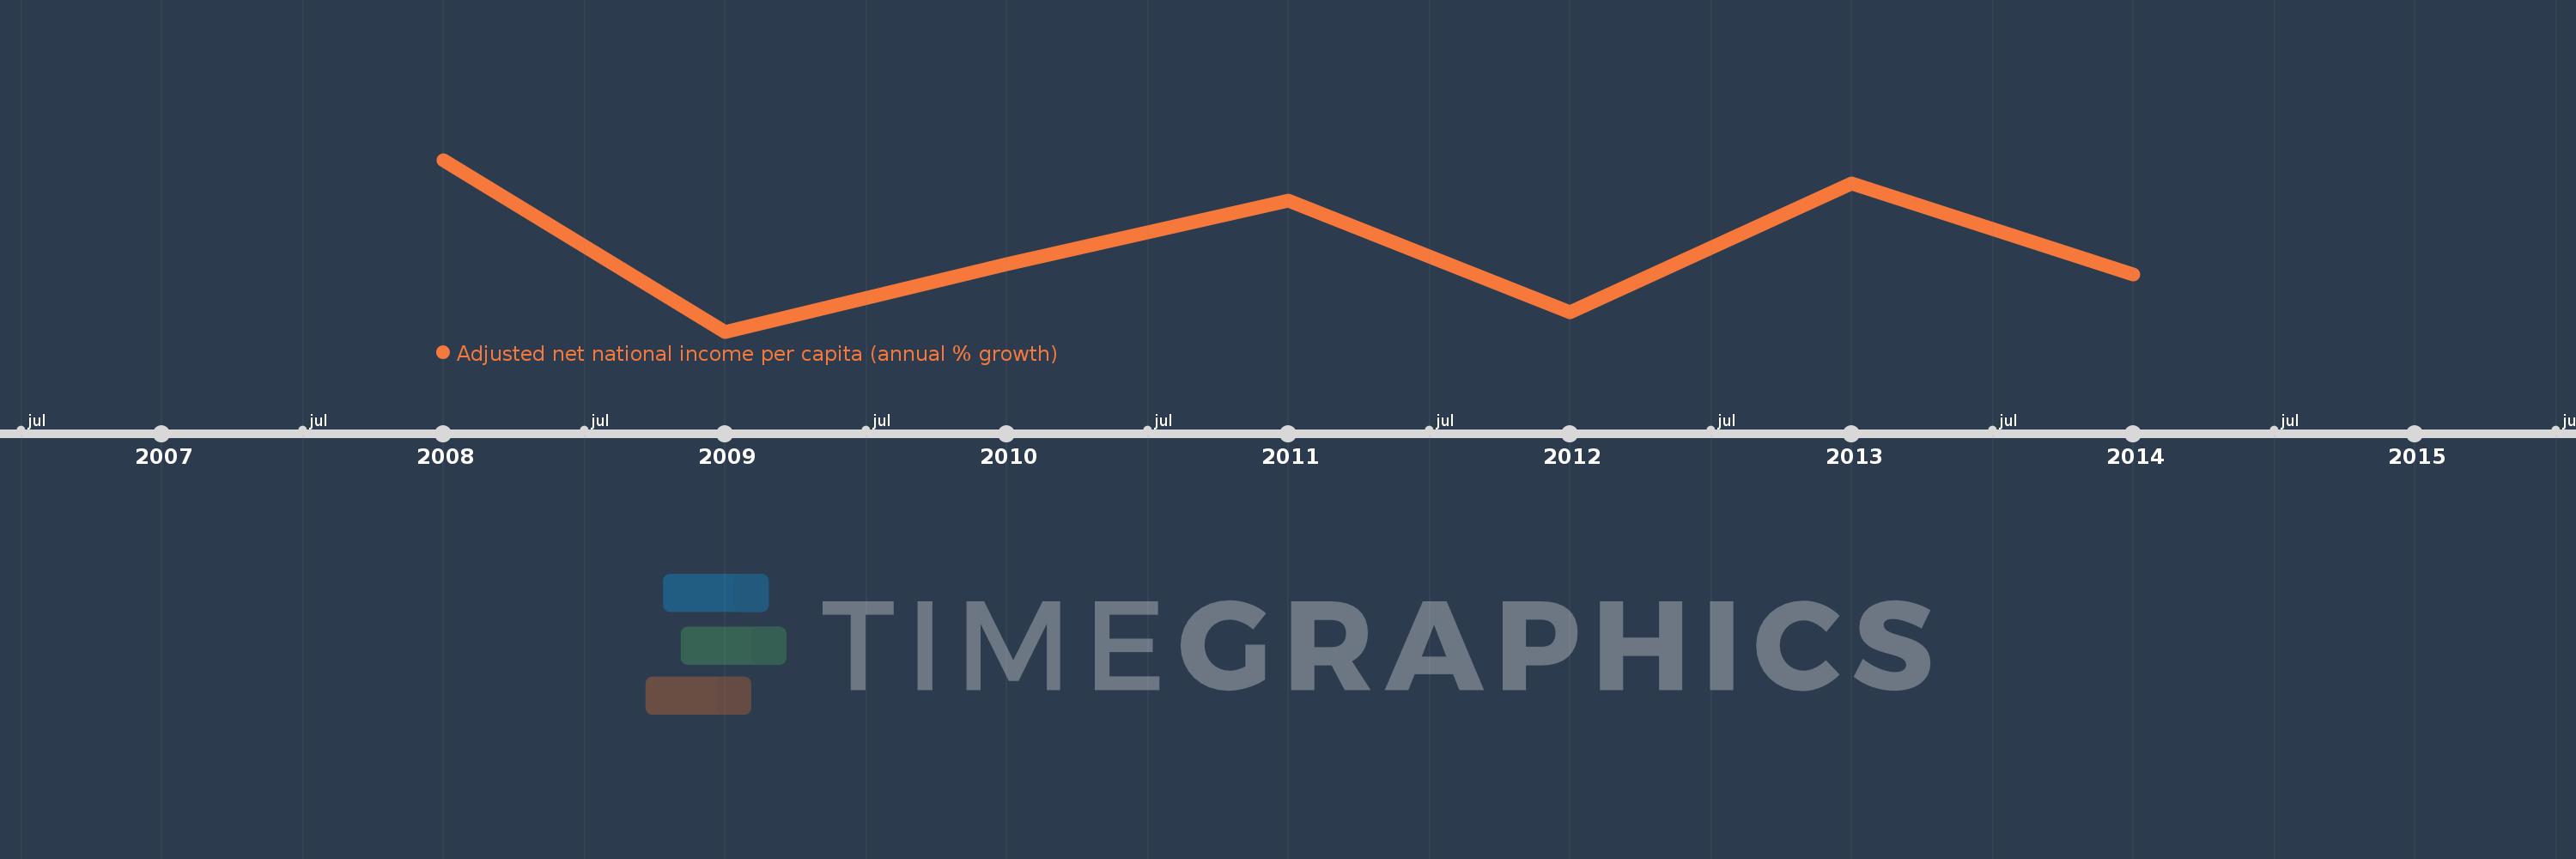
Adjusted net national income per capita (annual % growth)
2014,2013,2012,2011,2010,2009,2008
This statistics in other country:
Timeline:
This timeline shows a graph from 2008 to 2014 of Bahrain. No data until 2007. Number of actual observations by date: 7.
Source name:
World Development Indicators
Source organization:
World Bank staff estimates based on sources and methods in World Bank's "The Changing Wealth of Nations: Measuring Sustainable Development in the New Millennium" (2011).
Categories, topics:
Economy & Growth
Last updated:
apr 23, 2017
Indicators value changes by year
Minimum:
-6.093
jan 1, 2009
Maximum:
10.215
jan 1, 2008
At the date of observation
Value
Absolute change
Change from previous value
jan 1, 2008
10.215
+10.215
0.0%
jan 1, 2009
-6.093
-16.308
-159.65%
jan 1, 2010
0.306
+6.399
-105.02%
jan 1, 2011
6.38
+6.073
1.98K%
jan 1, 2012
-4.29
-10.67
-167.25%
jan 1, 2013
7.992
+12.282
-286.29%
jan 1, 2014
-0.699
-8.691
-108.74%
Ranking of countries by current statistics by years


Comments: