29
/
en
AIzaSyAYiBZKx7MnpbEhh9jyipgxe19OcubqV5w
April 1, 2024
230613
Rwanda
RWA
true
2
1
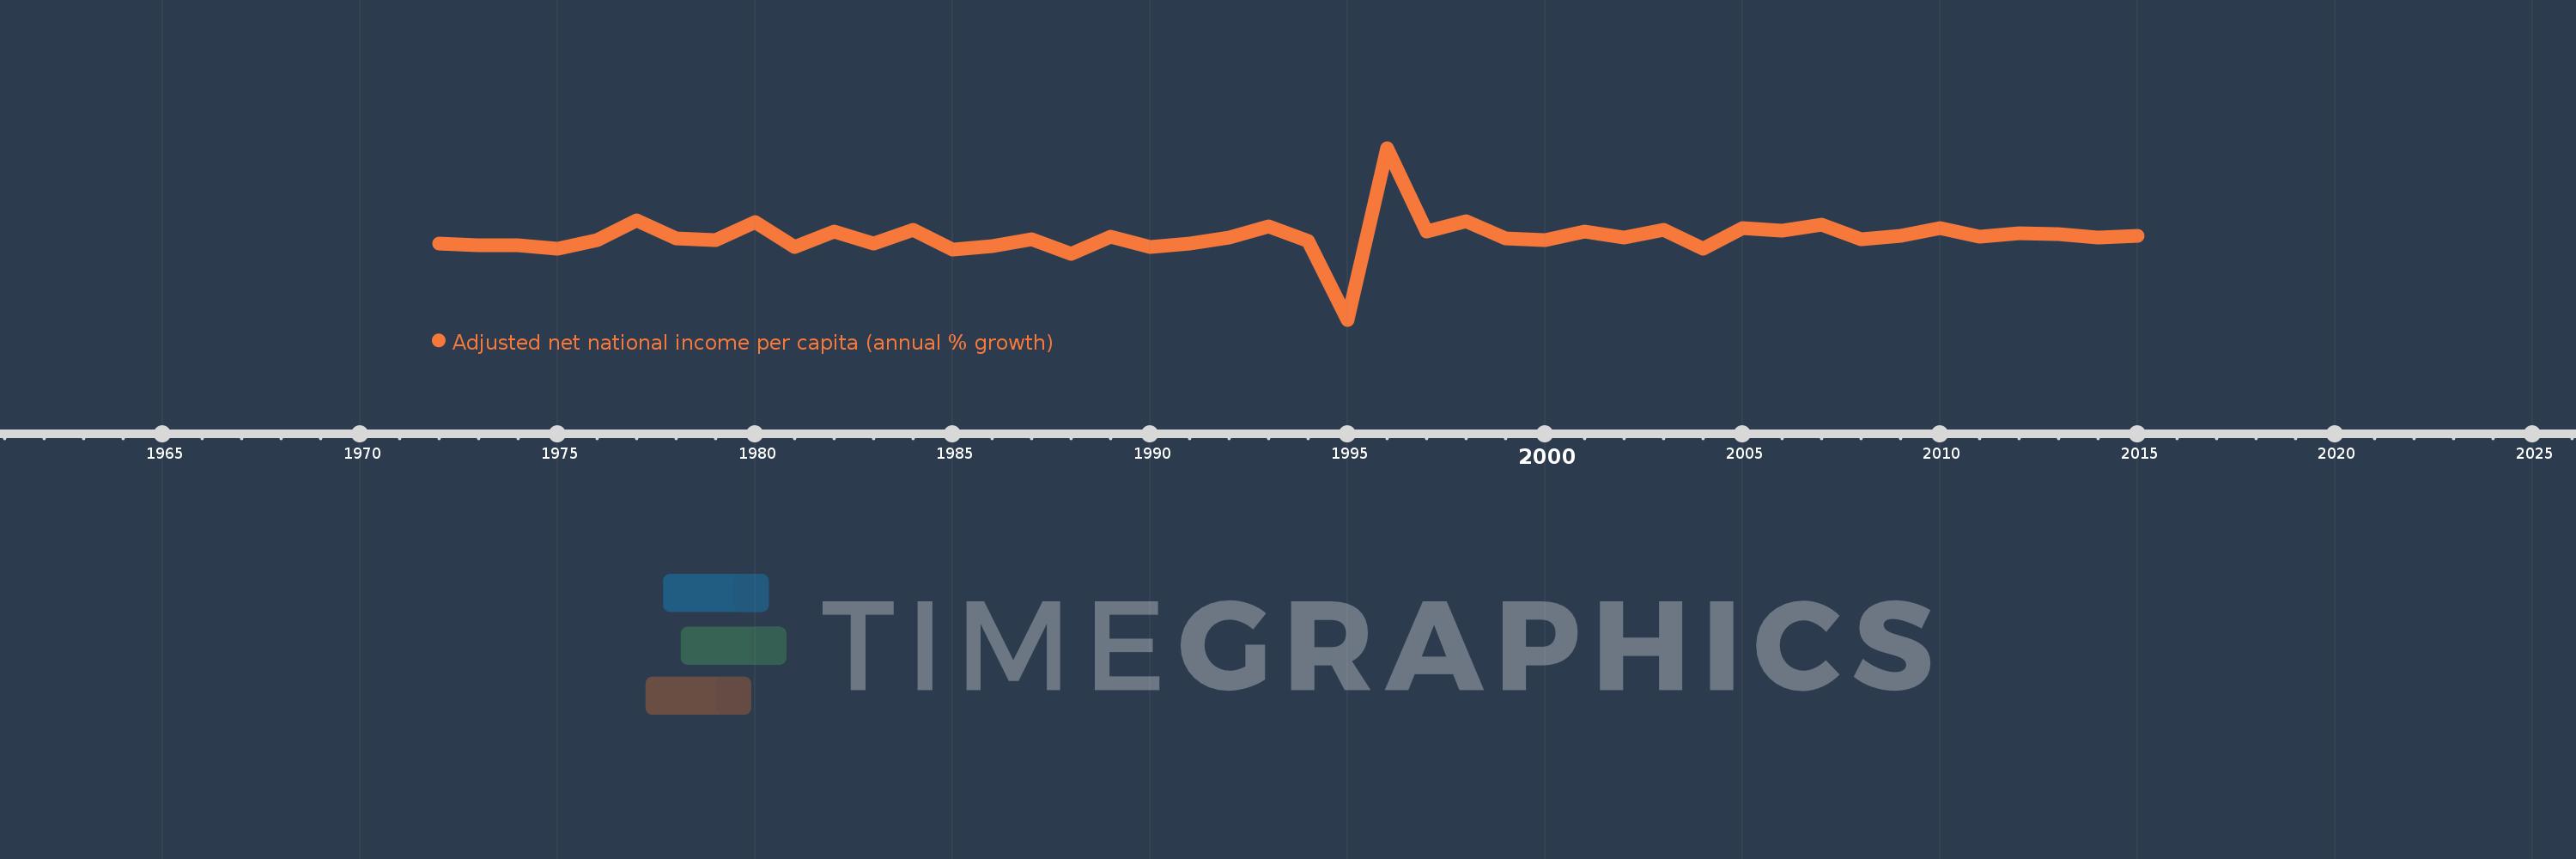
Adjusted net national income per capita (annual % growth)
2015,2014,2013,2012,2011,2010,2009,2008,2007,2006,2005,2004,2003,2002,2001,2000,1999,1998,1997,1996,1995,1994,1993,1992,1991,1990,1989,1988,1987,1986,1985,1984,1983,1982,1981,1980,1979,1978,1977,1976,1975,1974,1973,1972
This statistics in other country:
Timeline:
This timeline shows a graph from 1972 to 2015 of Rwanda. No data until 1971. Number of actual observations by date: 44.
Source name:
World Development Indicators
Source organization:
World Bank staff estimates based on sources and methods in World Bank's "The Changing Wealth of Nations: Measuring Sustainable Development in the New Millennium" (2011).
Categories, topics:
Economy & Growth
Last updated:
apr 23, 2017
Indicators value changes by year
Minimum:
-63.729
jan 1, 1995
Maximum:
74.943
jan 1, 1996
At the date of observation
Value
Absolute change
Change from previous value
jan 1, 1972
-1.958
-1.958
0.0%
jan 1, 1973
-3.584
-1.626
83.0%
jan 1, 1974
-3.457
+0.127
-3.54%
jan 1, 1975
-6.677
-3.22
93.13%
jan 1, 1976
0.392
+7.069
-105.88%
jan 1, 1977
16.603
+16.21
4.13K%
jan 1, 1978
1.969
-14.634
-88.14%
jan 1, 1979
0.518
-1.451
-73.7%
jan 1, 1980
14.848
+14.33
2.77K%
jan 1, 1981
-5.248
-20.095
-135.34%
jan 1, 1982
7.79
+13.037
-248.44%
jan 1, 1983
-2.144
-9.934
-127.53%
jan 1, 1984
9.093
+11.237
-524.1%
jan 1, 1985
-7.012
-16.105
-177.11%
jan 1, 1986
-4.061
+2.951
-42.08%
jan 1, 1987
1.291
+5.352
-131.79%
jan 1, 1988
-10.568
-11.859
-918.66%
jan 1, 1989
3.022
+13.59
-128.59%
jan 1, 1990
-4.816
-7.838
-259.36%
jan 1, 1991
-2.493
+2.323
-48.23%
jan 1, 1992
2.9
+5.394
-216.32%
jan 1, 1993
11.404
+8.503
293.18%
jan 1, 1994
0.059
-11.345
-99.48%
jan 1, 1995
-63.729
-63.788
-108.08K%
jan 1, 1996
74.943
+138.672
-217.6%
jan 1, 1997
7.439
-67.504
-90.07%
jan 1, 1998
15.466
+8.027
107.9%
jan 1, 1999
2.167
-13.299
-85.99%
jan 1, 2000
0.836
-1.331
-61.4%
jan 1, 2001
7.259
+6.423
767.91%
jan 1, 2002
2.456
-4.804
-66.17%
jan 1, 2003
9.129
+6.674
271.78%
jan 1, 2004
-6.1
-15.229
-166.81%
jan 1, 2005
10.015
+16.115
-264.2%
jan 1, 2006
8.235
-1.78
-17.77%
jan 1, 2007
13.203
+4.968
60.33%
jan 1, 2008
1.365
-11.838
-89.66%
jan 1, 2009
4.159
+2.794
204.68%
jan 1, 2010
10.092
+5.933
142.65%
jan 1, 2011
3.258
-6.835
-67.72%
jan 1, 2012
6.301
+3.043
93.42%
jan 1, 2013
5.412
-0.889
-14.11%
jan 1, 2014
2.495
-2.917
-53.9%
jan 1, 2015
3.881
+1.386
55.57%
Ranking of countries by current statistics by years


Comments: