29
/
en
AIzaSyAYiBZKx7MnpbEhh9jyipgxe19OcubqV5w
April 1, 2024
127963
Eritrea
ERI
true
2
1
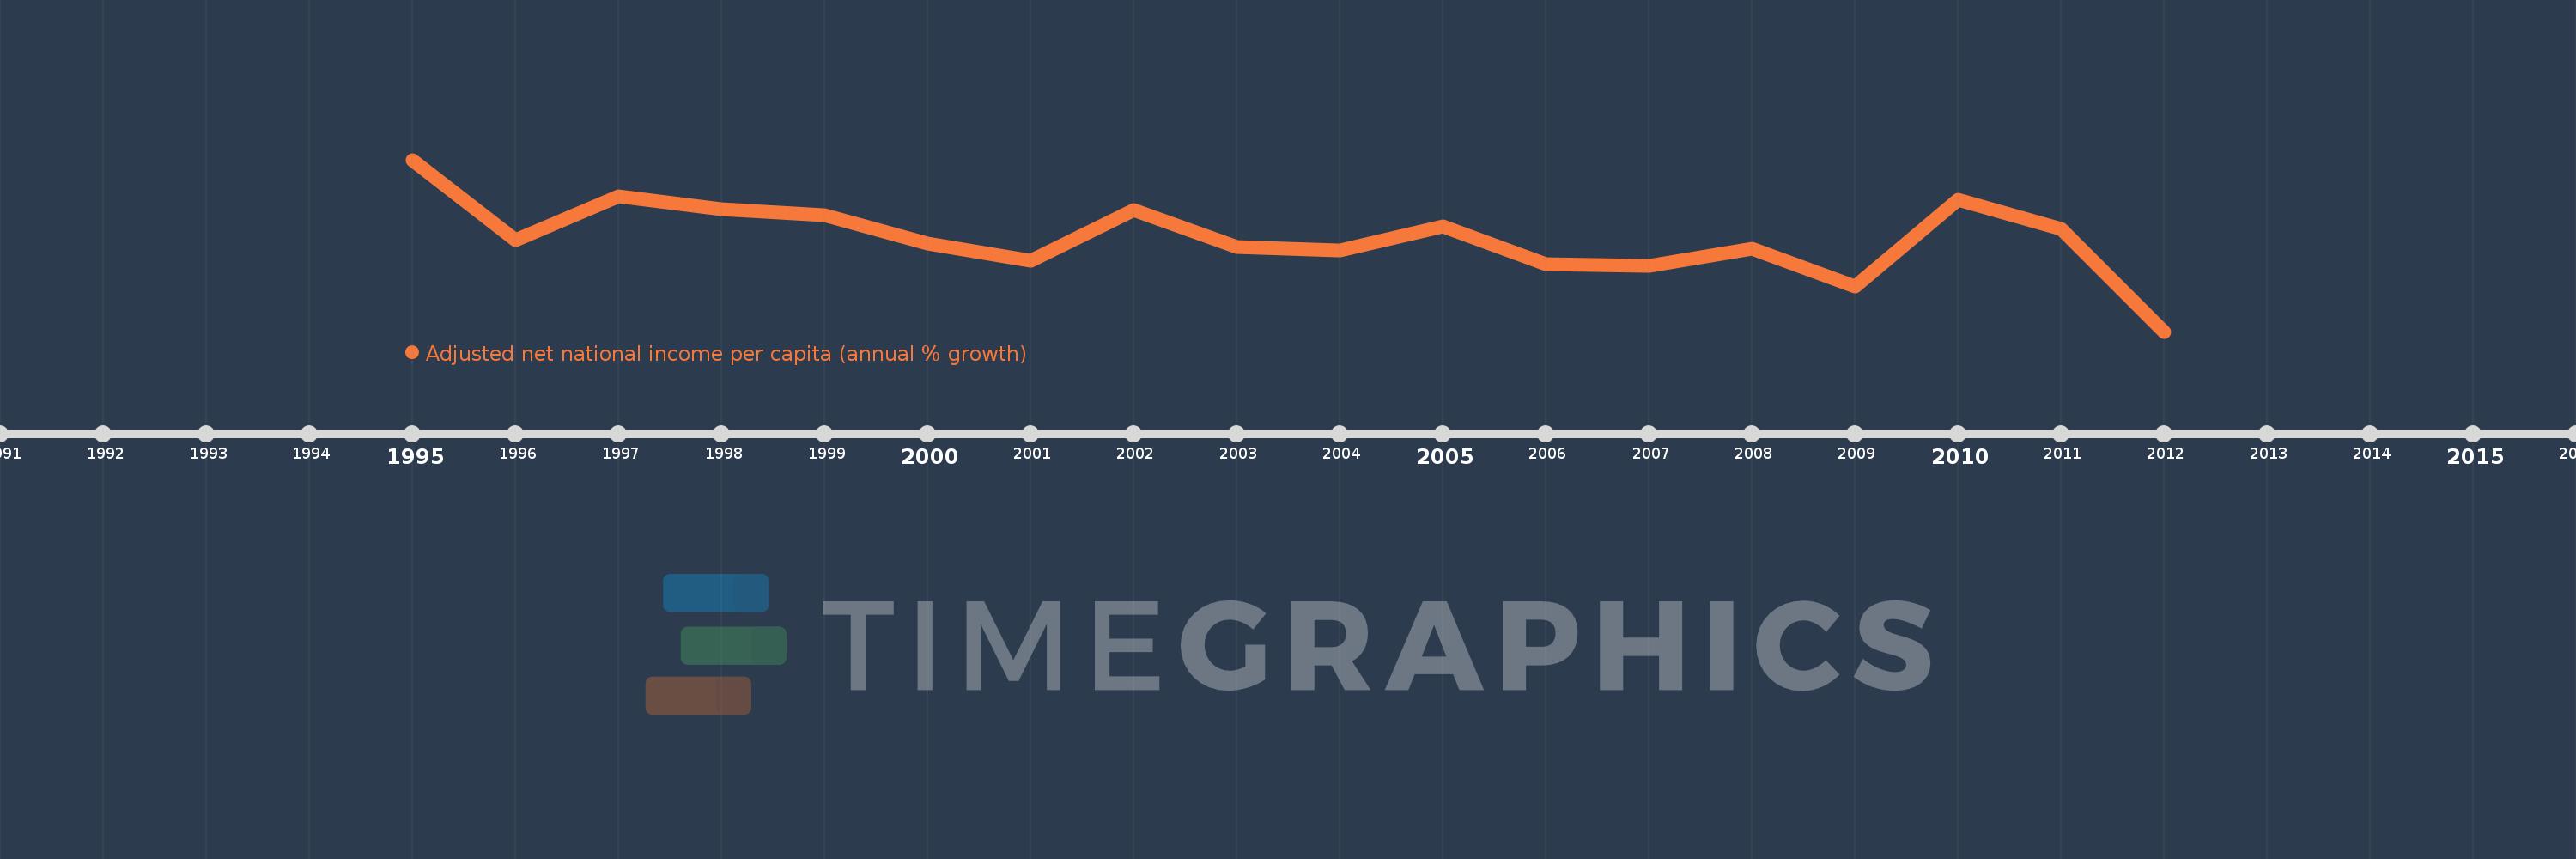
Adjusted net national income per capita (annual % growth)
2012,2011,2010,2009,2008,2007,2006,2005,2004,2003,2002,2001,2000,1999,1998,1997,1996,1995
This statistics in other country:
Timeline:
This timeline shows a graph from 1995 to 2012 of Eritrea. No data until 1994. Number of actual observations by date: 18.
Source name:
World Development Indicators
Source organization:
World Bank staff estimates based on sources and methods in World Bank's "The Changing Wealth of Nations: Measuring Sustainable Development in the New Millennium" (2011).
Categories, topics:
Economy & Growth
Last updated:
apr 23, 2017
Indicators value changes by year
Minimum:
-21.034
jan 1, 2012
Maximum:
16.516
jan 1, 1995
At the date of observation
Value
Absolute change
Change from previous value
jan 1, 1995
16.516
+16.516
0.0%
jan 1, 1996
-0.968
-17.484
-105.86%
jan 1, 1997
8.499
+9.467
-977.55%
jan 1, 1998
5.635
-2.863
-33.69%
jan 1, 1999
4.351
-1.284
-22.79%
jan 1, 2000
-1.83
-6.181
-142.05%
jan 1, 2001
-5.627
-3.797
207.55%
jan 1, 2002
5.608
+11.235
-199.66%
jan 1, 2003
-2.581
-8.189
-146.02%
jan 1, 2004
-3.332
-0.752
29.13%
jan 1, 2005
1.938
+5.27
-158.15%
jan 1, 2006
-6.373
-8.31
-428.87%
jan 1, 2007
-6.596
-0.223
3.5%
jan 1, 2008
-2.824
+3.772
-57.19%
jan 1, 2009
-11.088
-8.264
292.67%
jan 1, 2010
7.745
+18.834
-169.85%
jan 1, 2011
1.487
-6.258
-80.8%
jan 1, 2012
-21.034
-22.522
-1.51K%
Ranking of countries by current statistics by years


Comments: