29
/
en
AIzaSyAYiBZKx7MnpbEhh9jyipgxe19OcubqV5w
April 1, 2024
100790
Canada
CAN
true
2
1
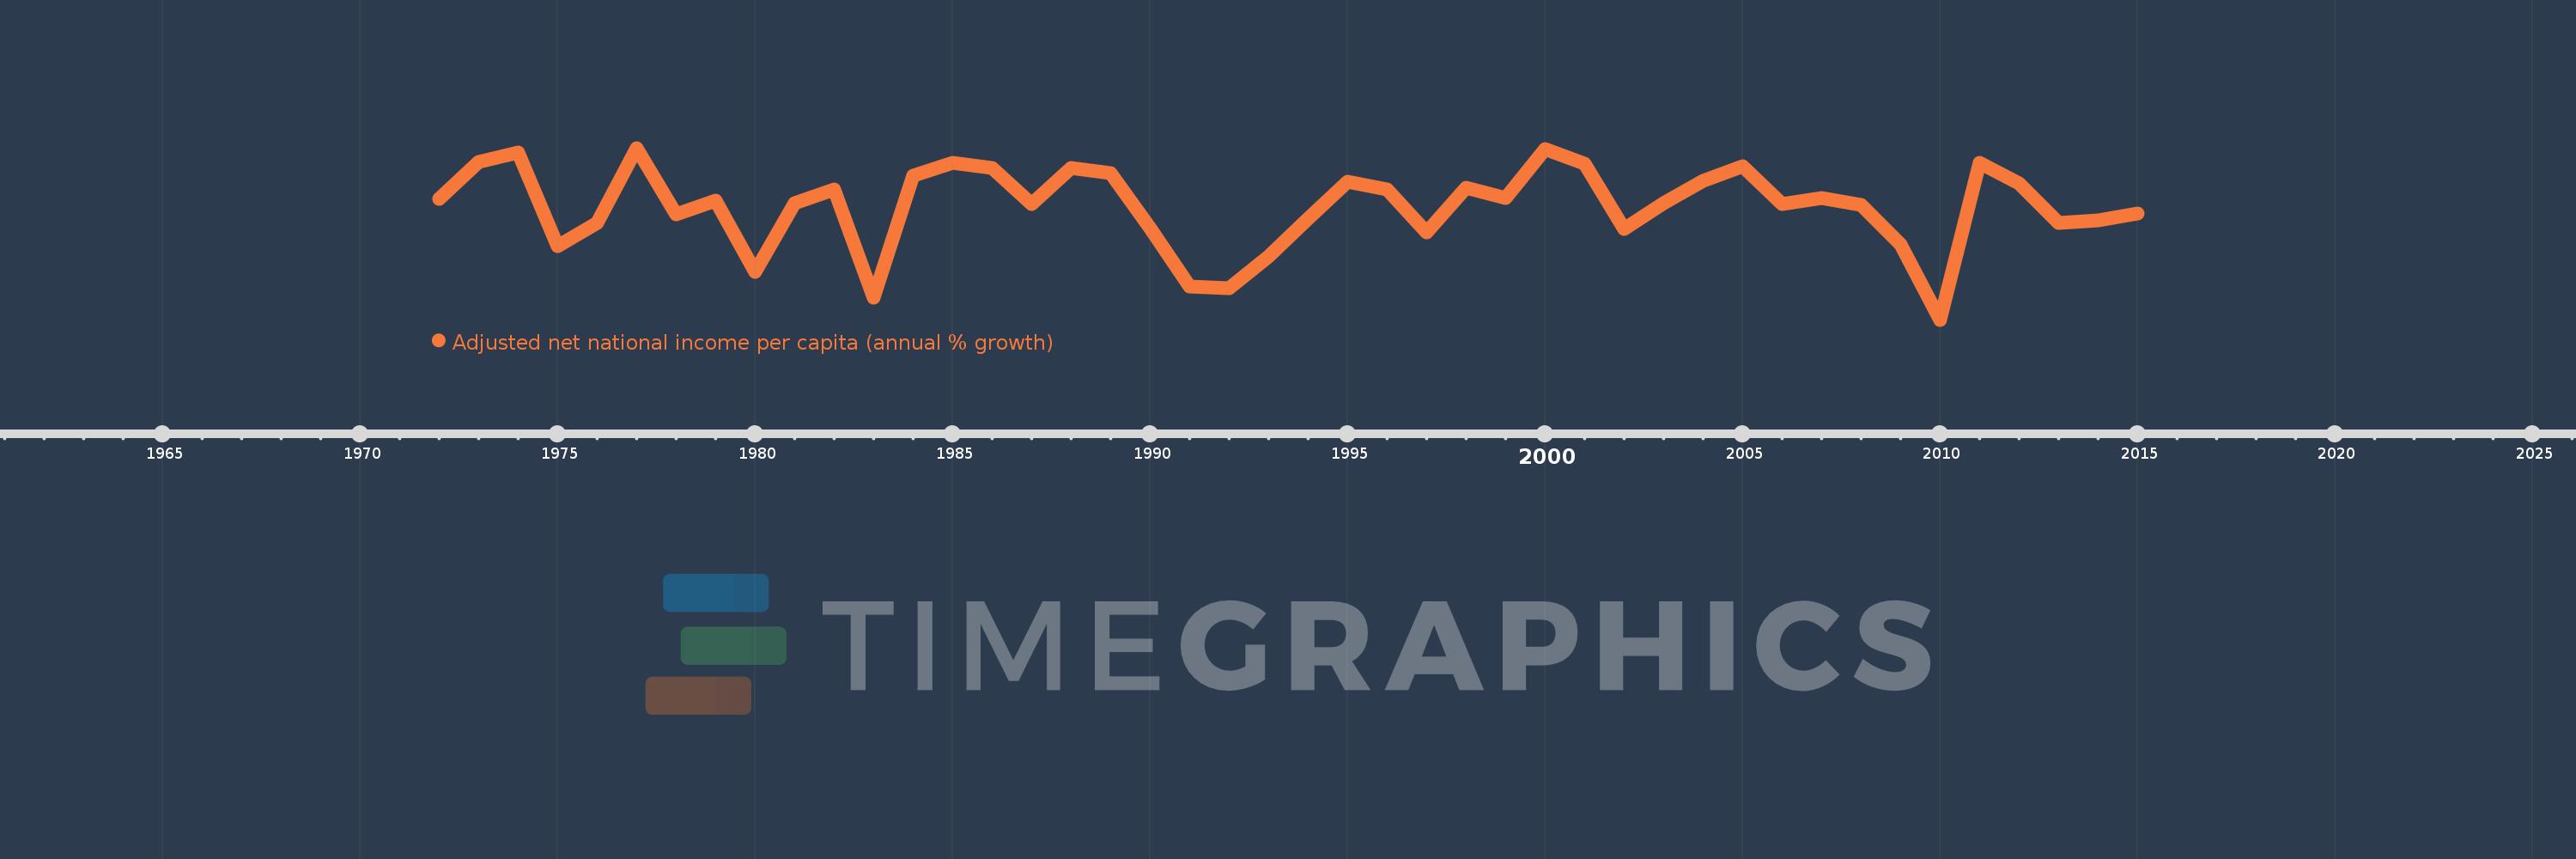
Adjusted net national income per capita (annual % growth)
2015,2014,2013,2012,2011,2010,2009,2008,2007,2006,2005,2004,2003,2002,2001,2000,1999,1998,1997,1996,1995,1994,1993,1992,1991,1990,1989,1988,1987,1986,1985,1984,1983,1982,1981,1980,1979,1978,1977,1976,1975,1974,1973,1972
This statistics in other country:
Timeline:
This timeline shows a graph from 1972 to 2015 of Canada. No data until 1971. Number of actual observations by date: 44.
Source name:
World Development Indicators
Source organization:
World Bank staff estimates based on sources and methods in World Bank's "The Changing Wealth of Nations: Measuring Sustainable Development in the New Millennium" (2011).
Categories, topics:
Economy & Growth
Last updated:
apr 23, 2017
Indicators value changes by year
Minimum:
-5.101
jan 1, 2010
At the date of observation
Value
Absolute change
Change from previous value
jan 1, 1972
2.08
+2.08
0.0%
jan 1, 1973
4.279
+2.2
105.78%
jan 1, 1974
4.809
+0.53
12.38%
jan 1, 1975
-0.74
-5.549
-115.39%
jan 1, 1976
0.622
+1.363
-184.09%
jan 1, 1977
5.089
+4.467
717.6%
jan 1, 1978
1.132
-3.957
-77.75%
jan 1, 1979
1.969
+0.836
73.86%
jan 1, 1980
-2.287
-4.256
-216.19%
jan 1, 1981
1.8
+4.087
-178.68%
jan 1, 1982
2.652
+0.852
47.36%
jan 1, 1983
-3.809
-6.461
-243.63%
jan 1, 1984
3.435
+7.244
-190.2%
jan 1, 1985
4.232
+0.797
23.19%
jan 1, 1986
3.918
-0.314
-7.42%
jan 1, 1987
1.785
-2.133
-54.44%
jan 1, 1988
3.897
+2.112
118.31%
jan 1, 1989
3.579
-0.318
-8.15%
jan 1, 1990
0.358
-3.222
-90.01%
jan 1, 1991
-3.145
-3.503
-979.39%
jan 1, 1992
-3.223
-0.078
2.47%
jan 1, 1993
-1.34
+1.884
-58.44%
jan 1, 1994
0.894
+2.233
-166.71%
jan 1, 1995
3.094
+2.2
246.27%
jan 1, 1996
2.653
-0.441
-14.25%
jan 1, 1997
0.097
-2.556
-96.35%
jan 1, 1998
2.71
+2.613
2.7K%
jan 1, 1999
2.099
-0.611
-22.53%
jan 1, 2000
5.017
+2.917
138.95%
jan 1, 2001
4.152
-0.864
-17.23%
jan 1, 2002
0.298
-3.855
-92.83%
jan 1, 2003
1.811
+1.513
508.24%
jan 1, 2004
3.141
+1.331
73.47%
jan 1, 2005
3.991
+0.849
27.04%
jan 1, 2006
1.787
-2.204
-55.22%
jan 1, 2007
2.115
+0.328
18.33%
jan 1, 2008
1.716
-0.399
-18.86%
jan 1, 2009
-0.652
-2.368
-138.02%
jan 1, 2010
-5.101
-4.449
682.06%
jan 1, 2011
4.2
+9.301
-182.32%
jan 1, 2012
3.008
-1.192
-28.38%
jan 1, 2013
0.666
-2.341
-77.84%
jan 1, 2014
0.786
+0.12
18.0%
jan 1, 2015
1.226
+0.44
55.92%
Ranking of countries by current statistics by years


Comments: