30
/
AIzaSyAYiBZKx7MnpbEhh9jyipgxe19OcubqV5w
April 1, 2024
160173
Israel
ISR
true
2
1
Adjusted net national income per capita (annual % growth)
2015,2014,2013,2012,2011,2010,2009,2008,2007,2006,2005,2004,2003,2002,2001,2000,1999,1998,1997
Download
Global statistics library →Israel →

Adjusted net national income per capita (annual % growth)

This statistics in other country:

AlbaniaAlgeriaAngolaArab WorldArgentinaArmeniaAustraliaAustriaAzerbaijanBahamas, TheBahrainBangladeshBarbadosBelarusBelgiumBelizeBeninBhutanBoliviaBotswanaBrazilBrunei DarussalamBulgariaBurkina FasoBurundiCabo VerdeCambodiaCameroonCanadaCaribbean small statesCentral Europe and the BalticsChadChileChinaColombiaComorosCongo, Dem. Rep.Congo, Rep.Costa RicaCote d'IvoireCroatiaCubaCyprusCzech RepublicDenmarkDjiboutiDominican RepublicEarly-demographic dividendEcuadorEgypt, Arab Rep.El SalvadorEquatorial GuineaEritreaEstoniaEthiopiaEuro areaEurope & Central AsiaEurope & Central Asia (excluding high income)Europe & Central Asia (IDA & IBRD countries)European UnionFijiFinlandFranceGabonGambia, TheGeorgiaGermanyGhanaGreeceGuatemalaGuineaGuinea-BissauHaitiHeavily indebted poor countries (HIPC)High incomeHondurasHungaryIBRD onlyIcelandIDA & IBRD totalIDA blendIDA onlyIDA totalIndiaIndonesiaIran, Islamic Rep.IrelandIsraelItalyJamaicaJapanJordanKazakhstanKenyaKorea, Rep.KuwaitKyrgyz RepublicLao PDRLatin America & Caribbean Latin America & Caribbean (excluding high income)Latin America & the Caribbean (IDA & IBRD countries)LatviaLeast developed countries: UN classificationLebanonLiberiaLibyaLithuaniaLow & middle incomeLow incomeLower middle incomeLuxembourgMacedonia, FYRMadagascarMalawiMalaysiaMaliMauritaniaMauritiusMexicoMiddle East & North AfricaMiddle East & North Africa (excluding high income)Middle East & North Africa (IDA & IBRD countries)Middle incomeMoldovaMongoliaMoroccoMozambiqueMyanmarNamibiaNepalNetherlandsNew ZealandNicaraguaNigerNigeriaNorth AmericaNorwayOECD membersOmanOther small statesPakistanPanamaPapua New GuineaParaguayPeruPhilippinesPolandPortugalPost-demographic dividendPre-demographic dividendQatarRomaniaRussian FederationRwandaSamoaSaudi ArabiaSenegalSeychellesSierra LeoneSingaporeSlovak RepublicSloveniaSmall statesSouth AfricaSouth AsiaSouth Asia (IDA & IBRD)SpainSri LankaSub-Saharan Africa Sub-Saharan Africa (excluding high income)Sub-Saharan Africa (IDA & IBRD countries)SudanSurinameSwazilandSwedenSwitzerlandSyrian Arab RepublicTajikistanTanzaniaThailandTogoTrinidad and TobagoTunisiaTurkeyTurkmenistanUgandaUkraineUnited Arab EmiratesUnited KingdomUnited StatesUruguayUzbekistanVanuatuVenezuela, RBVietnamWorldZambiaZimbabwe

Timeline:

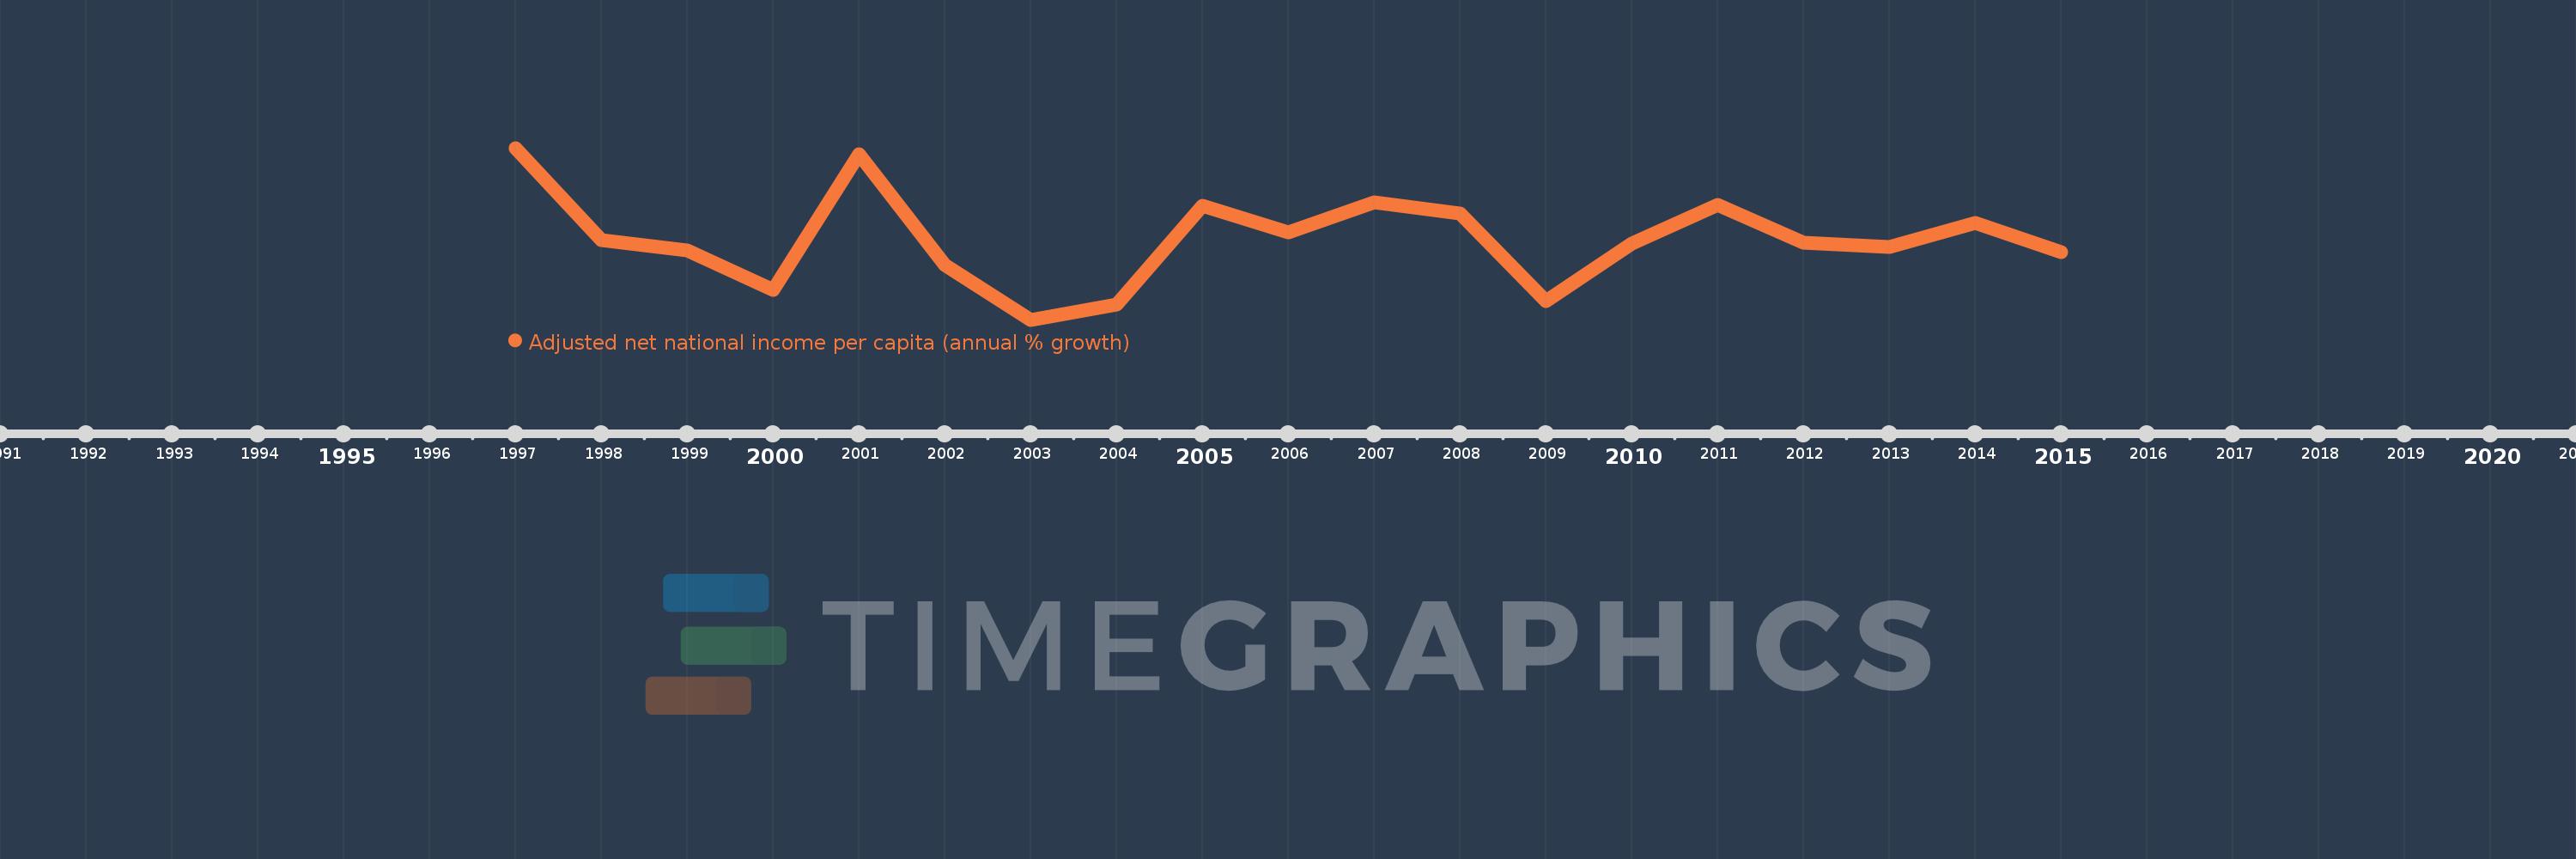
This timeline shows a graph from 1997 to 2015 of Israel. No data until 1996. Number of actual observations by date: 19.

Source name:

World Development Indicators

Source organization:

World Bank staff estimates based on sources and methods in World Bank's "The Changing Wealth of Nations: Measuring Sustainable Development in the New Millennium" (2011).

Categories, topics:

Economy & Growth

Last updated:

apr 23, 2017

Indicators value changes by year

Meaning:
2.423
Minimum:
-2.385
jan 1, 2003
Maximum:
7.84
jan 1, 1997
At the date of observation
Value
Absolute change
Change from the previous value
jan 1, 1997
7.84
+7.84
0.0%
jan 1, 1998
2.372
-5.468
-69.75%
jan 1, 1999
1.732
-0.64
-26.98%
jan 1, 2000
-0.605
-2.337
-134.93%
jan 1, 2001
7.482
+8.087
-1.34K%
jan 1, 2002
0.871
-6.611
-88.36%
jan 1, 2003
-2.385
-3.256
-373.93%
jan 1, 2004
-1.467
+0.918
-38.51%
jan 1, 2005
4.392
+5.858
-399.44%
jan 1, 2006
2.792
-1.599
-36.41%
jan 1, 2007
4.603
+1.81
64.83%
jan 1, 2008
3.916
-0.687
-14.93%
jan 1, 2009
-1.284
-5.2
-132.78%
jan 1, 2010
2.126
+3.41
-265.61%
jan 1, 2011
4.449
+2.323
109.26%
jan 1, 2012
2.225
-2.224
-49.98%
jan 1, 2013
1.97
-0.255
-11.46%
jan 1, 2014
3.376
+1.406
71.35%
jan 1, 2015
1.63
-1.746
-51.71%

Ranking of countries by current statistics by years